Monitoring Coder
Monitor your Coder deployment with logs, metrics, health checks, and alerting best practices.
On this page
Learn about our the tools, techniques, and best practices to monitor your Coder deployment.
Quick Start: Observability Helm Chart
Deploy Prometheus, Grafana, Alert Manager, and pre-built dashboards on your Kubernetes cluster to monitor the Coder control plane, provisioners, and workspaces.
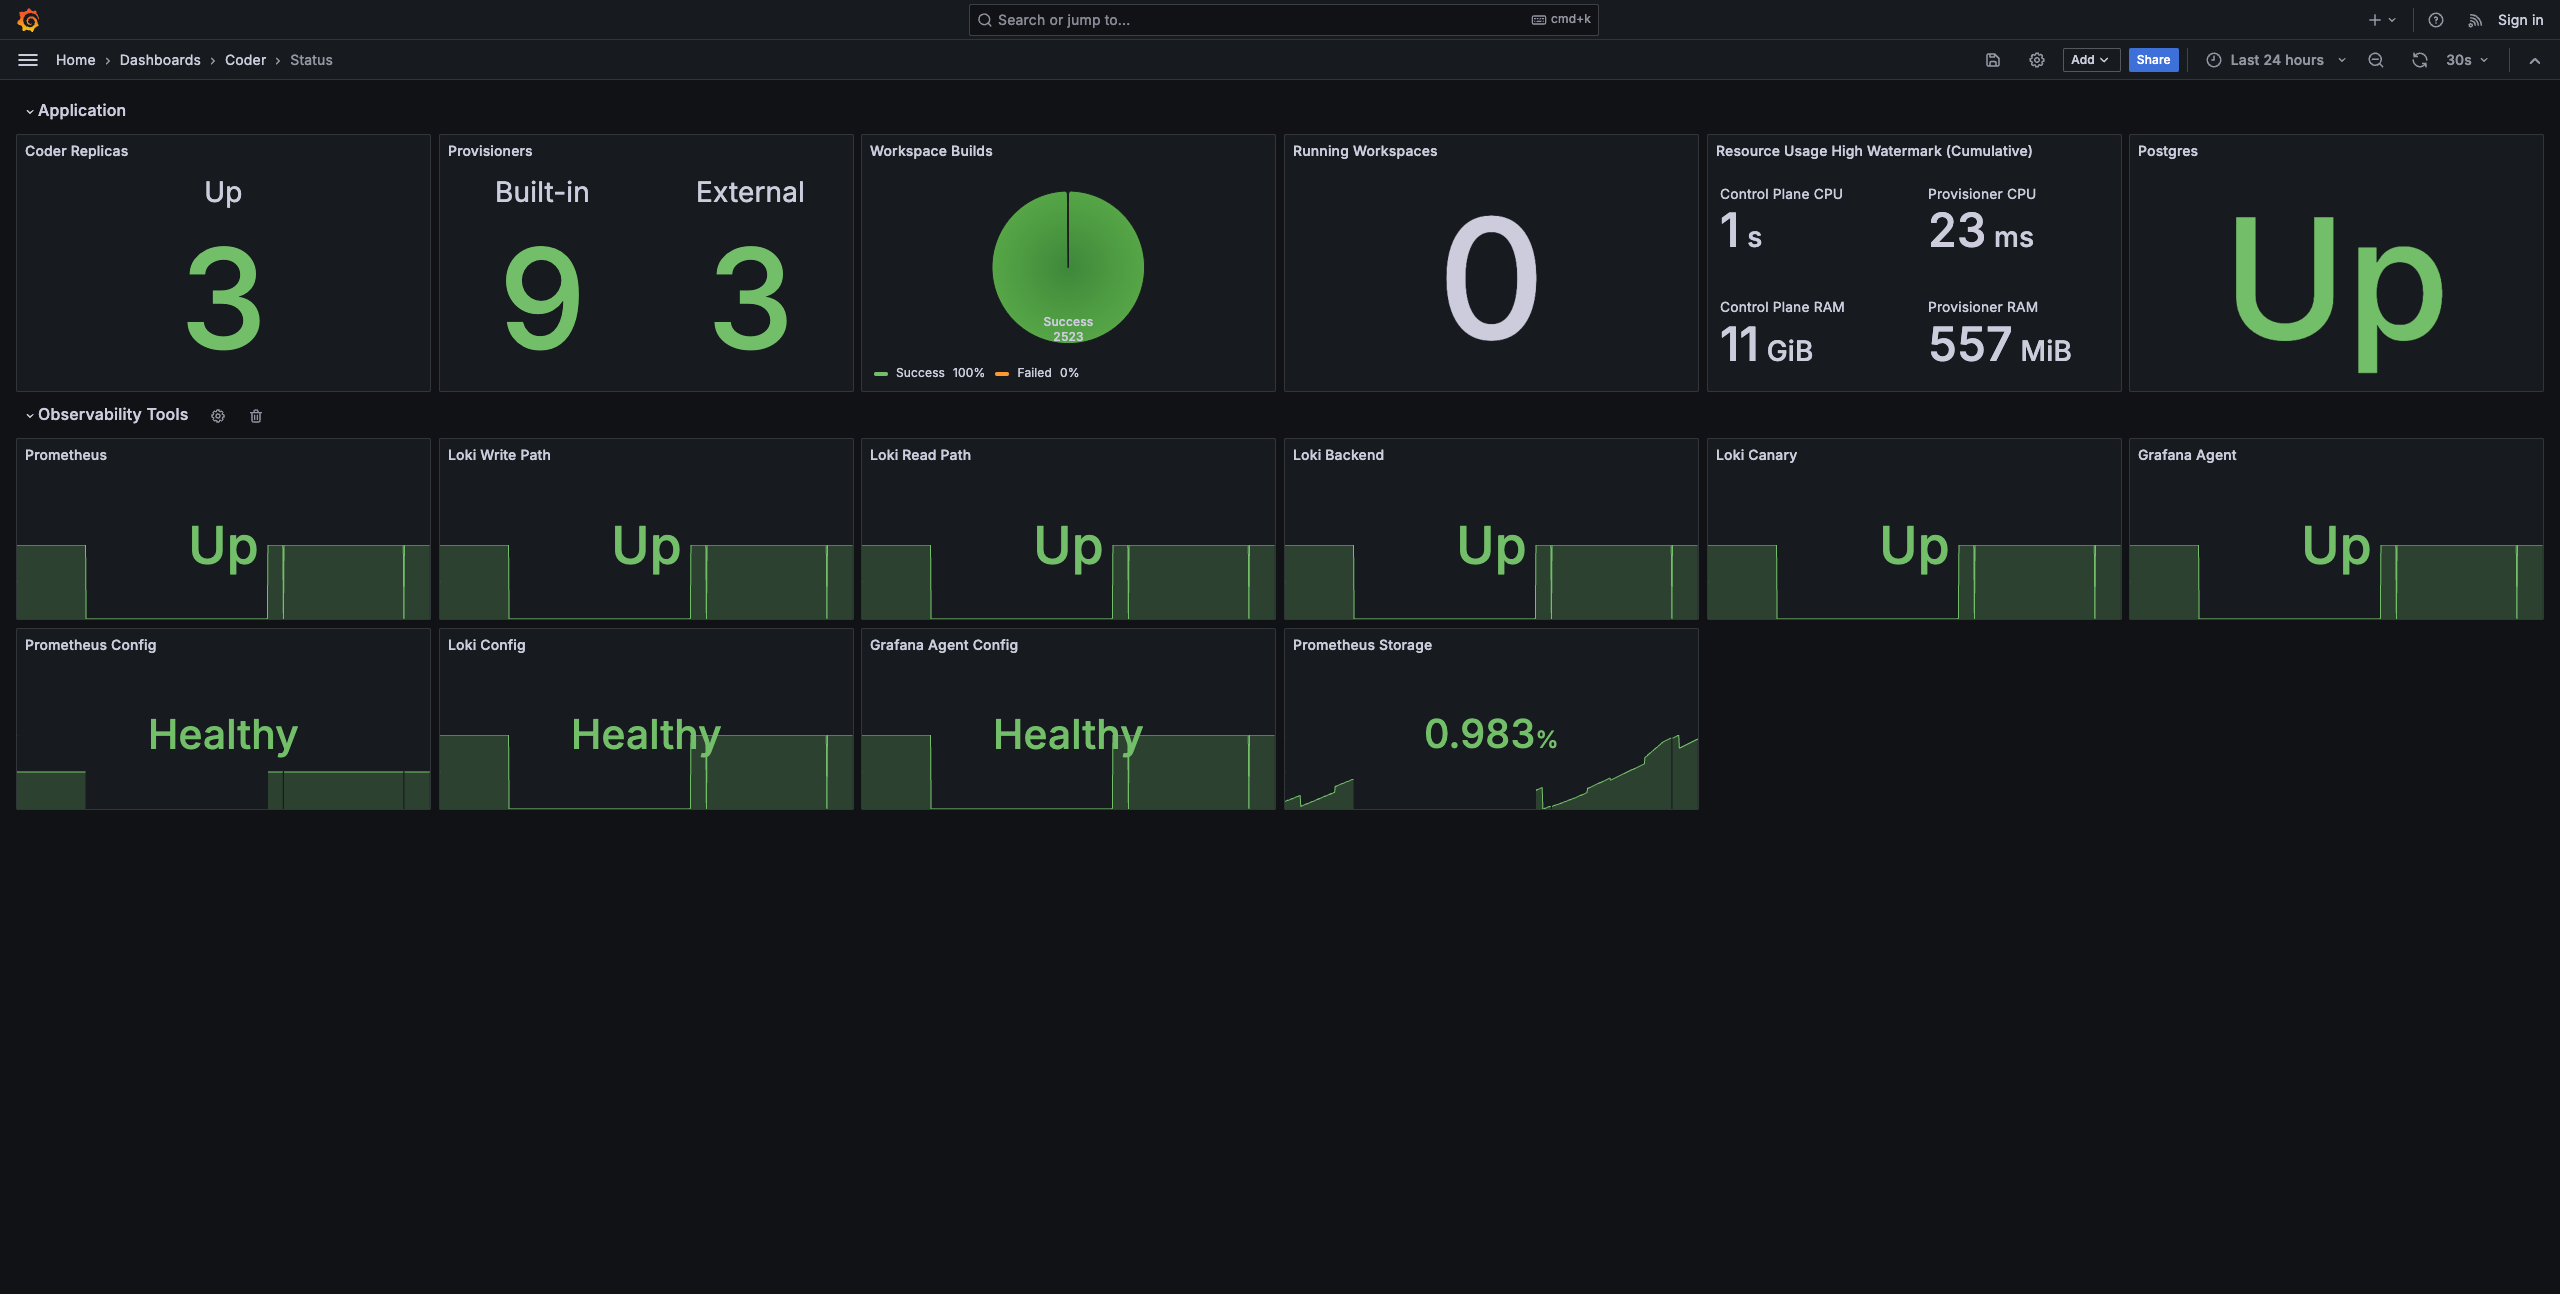
Learn how to install & read the docs on the Observability Helm Chart GitHub
Table of Contents
- Logs: Learn how to access to Coder server logs, agent logs, and even how to expose Kubernetes pod scheduling logs.
- Metrics: Learn about the valuable metrics to measure on a Coder deployment, regardless of your monitoring stack.
- Health Check: Learn about the periodic health check and error codes that run on Coder deployments.
- Connection Logs: Monitor connections to workspaces.