

How We Improved the Performance of a Userspace TCP Stack in Go by 5X
Coder 2.12.0 is here and it's 5X faster than 2.9.0
At Coder we’re in the business of making cloud development environments awesome. When you are developing remotely, the speed and quality of the connection you have to your workspace is a big driver of the overall experience you’ll have. One important measure of how good your connection is:
Throughput - the rate at which you can send or receive data across a network
Throughput is usually quoted in bits per second, and on modern internet networks, these range from a few millions of bits per second (Mb/s) to a few billions of bits per second (Gb/s).
You will really notice throughput differences when copying files to and from your workspace, or testing web applications that push heavy assets.
Coder v2.12, which we have just released, includes several networking improvements that together increase throughput dramatically: over 5x in some cases. Below is a comparison of throughput test results for 3 different versions of Coder, across 3 different AWS environments with different latencies. They are all based on t3.xlarge VM instances. Your throughput will vary based on many factors besides latency including the speed of your connection and network congestion.
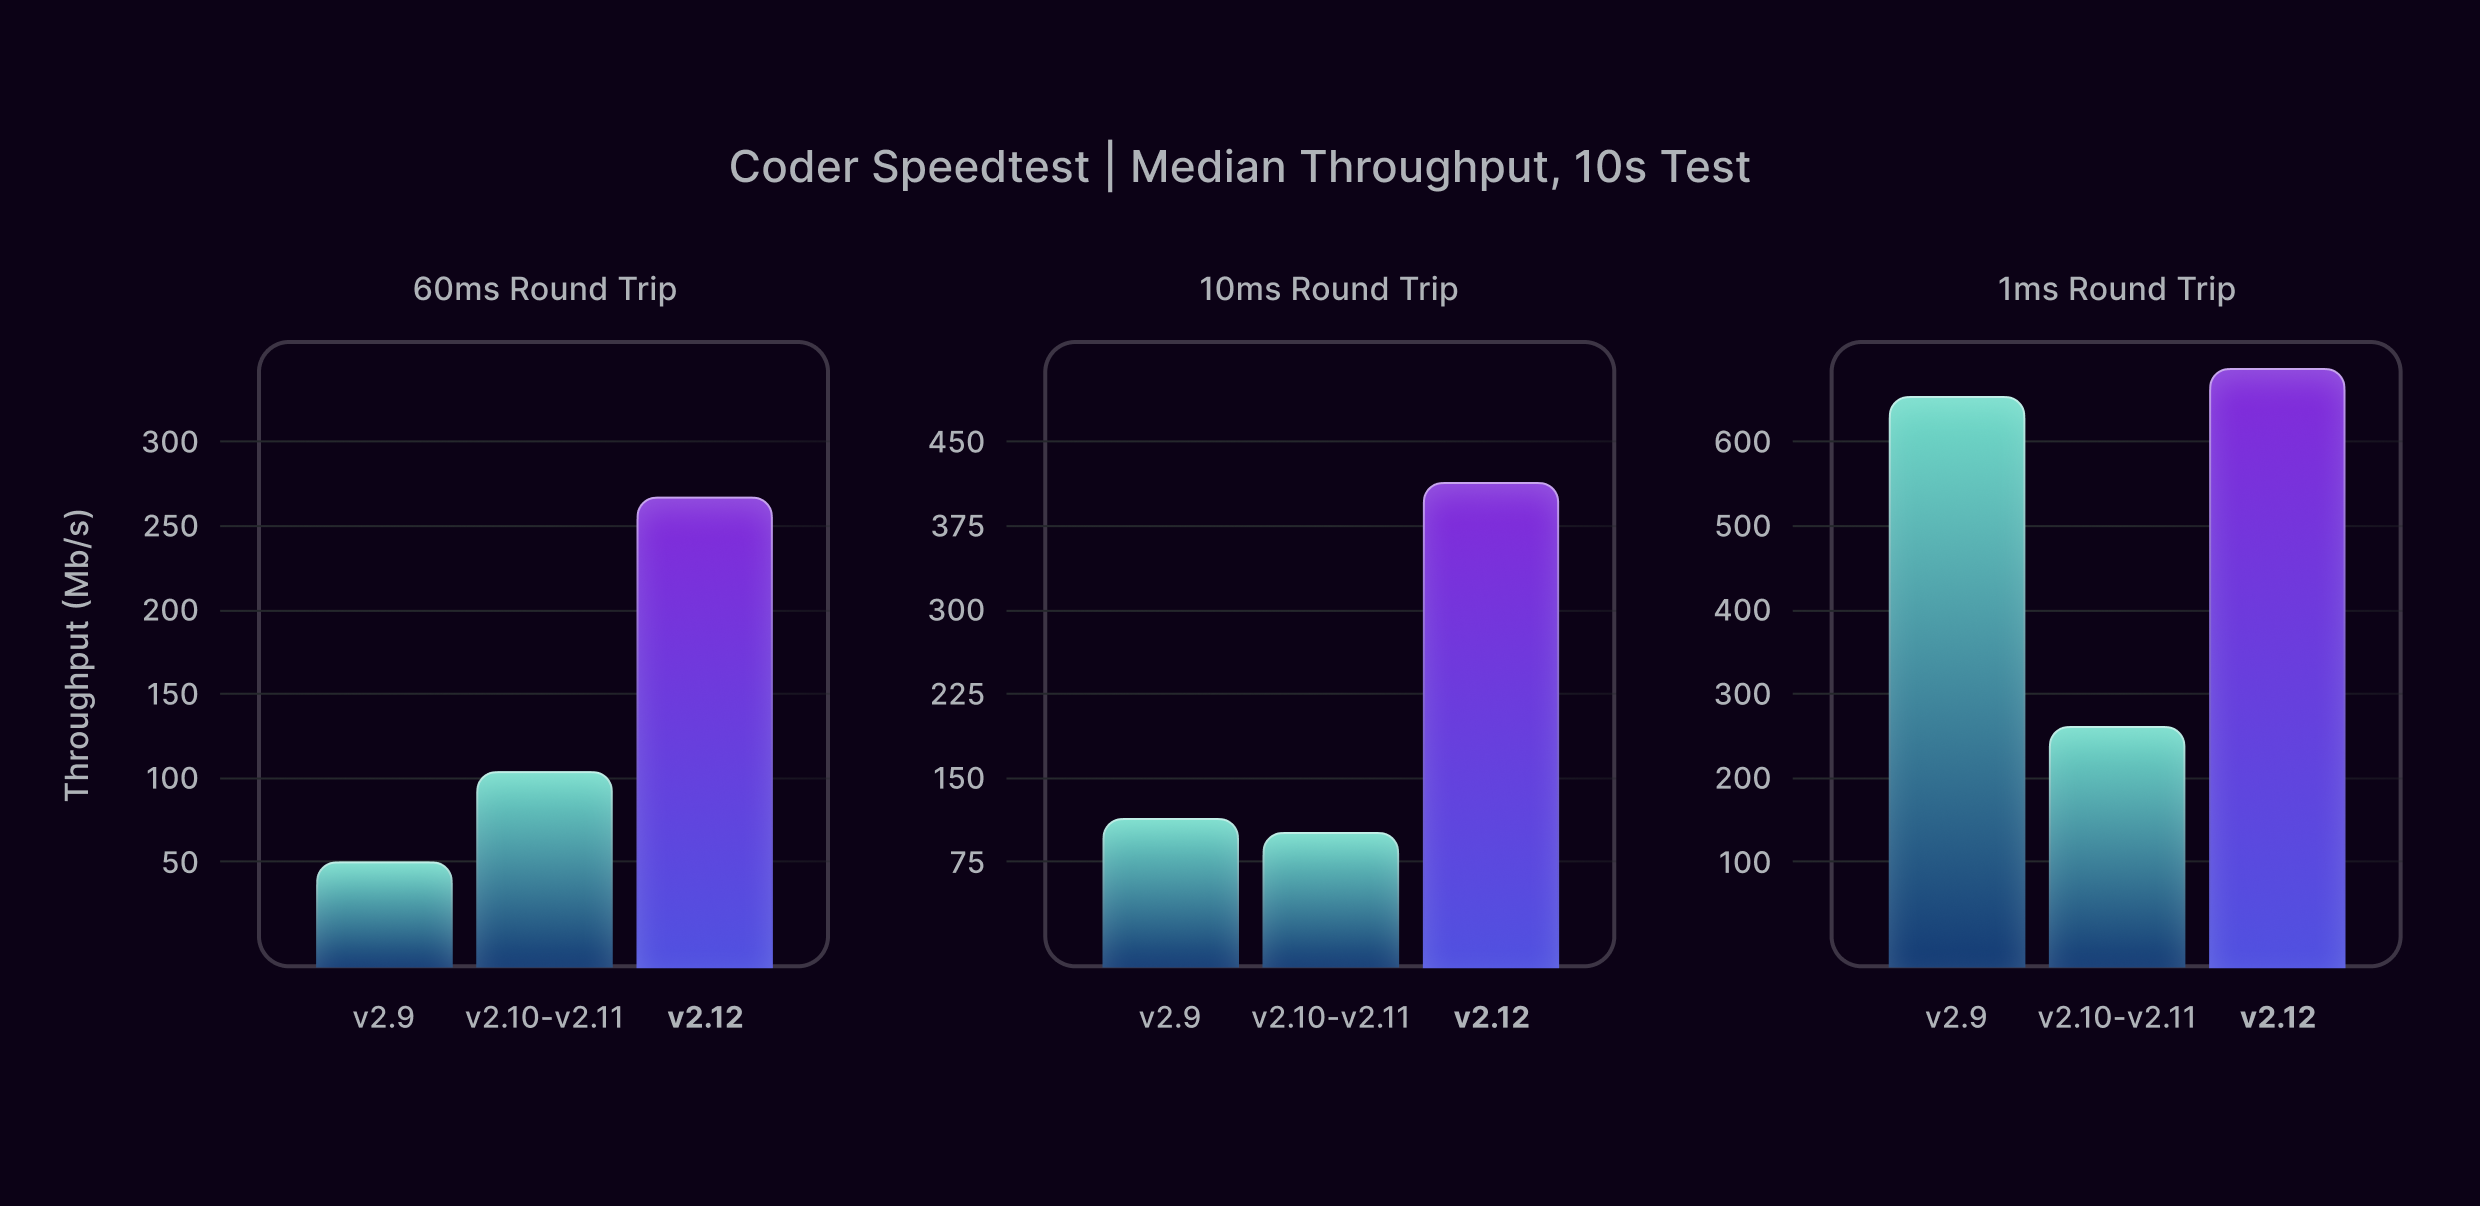
The 60ms test is from us-east-1 to us-west-1, and is a typical latency you might experience connecting to a Coder Workspace relatively far from home, say, across the continental USA.
The 10ms test is from us-east-1 to us-east-2, and is a typical latency you might experience if you are connecting to a Coder Workspace within the same geographic region.
The 1ms test is within us-east-1, and is an extremely low latency connection you might only achieve if you are connecting to a Coder Workspace hosted by your company on-premise, within the same building or corporate campus.
The rest of this post is a deep-dive into how we achieved these throughput increases. Coder builds an end-to-end encrypted tunnel to your workspace, and as such the theoretical maximum throughput to your workspace will be slightly lower than that of the underlying network path due to tunnel overheads, but in our testing we found a significant contribution to reduced throughput was the performance of the embedded TCP stack.
Wait, Coder Has an Embedded TCP Stack?
The TCP stack is not something that most software engineers think about that often, even those that are working deep in the backend. Most application software, even server software, does not have a TCP stack embedded even though TCP is essential to the web and the majority of application protocols. The reason is simple: it’s handled in the OS! When you want to speak TCP you just ask the OS to open a socket for you.
So, why doesn’t Coder do that?
We are committed to keeping your data safe through end-to-end encryption and to making Coder easy to run across a wide variety of systems from client laptops and desktops to VMs, containers, and bare metal. If we used the TCP implementation in the OS, we’d need a way for the TCP packets to get from the operating system back into Coder for encryption. This is called a TUN device in unix-style operating systems and creating one requires elevated permissions, limiting who can run Coder and where. Asking for elevated permissions inside secure clusters at regulated financial enterprises or top secret government networks is at best a big delay and at worst a nonstarter.
Instead, Coder embeds the networking stack from gVisor. gVisor is a container runtime that reimplements the entire Linux ABI (syscalls) in Go, but we only need the networking for our purposes. gVisor is deployed extensively by Google in their Cloud offerings, so it is mature and stable, but in our testing, we find that it is not always optimized for our use case.
Google uses gVisor within the data center, where networks have high bandwidth and extremely low latency (hundreds of μs to few ms). Coder users have 10x to 100x more latency, and this can have a big difference in network throughput. We’ve had to make some changes both to how gVisor is configured and to gVisor itself to make it perform well for Coder users.
A Tale of TCP Buffers
The promise that a TCP socket makes is that it will deliver a stream of bytes for you, and it will handle reordered or dropped packets, so the receiving application gets your data in order.
TCP uses buffers both when sending and receiving data to handle this. When sending data, it keeps a copy of the data in the buffer until the other TCP stack explicitly acknowledges receipt, in case it needs to be retransmitted. When receiving data, it keeps out-of-order data in the buffer until the in-order data arrives.
TCP data is being tracked in the buffers, and can’t be deleted until it’s delivered in order to the receiving application, which takes some time (the latency). Because of this, the maximum theoretical throughput you can achieve with TCP is directly proportional to the buffer sizes, and inversely proportional to the latency.
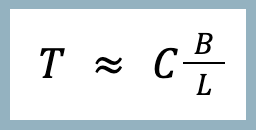
Where T is the throughput, C is some constant (approximately 1), B is the buffer size 1, and L is the latency.
This might be a surprising result at first! We often explain packet switched networking with the analogy of the postal system. If I live in California and am writing letters to my friends in Texas and Florida, it’s easy to imagine that I could post as many letters as I want to them. Sure, the letters might take an extra day to reach my friend in Florida, but the rate at which I send them and the rate at which they could arrive shouldn’t be fundamentally limited by that delay.
The key here is that we’re ensuring reliable delivery. The postal system, in our little analogy, loses letters all the time and doesn’t even offer registered mail2. So, I have to keep copies of all my letters until my friends write back to say they got them. If I send 10 letters per day, and it takes 2 days to deliver to Texas (and 2 more days to get a reply), then I better have space for 40 letters. If I try to do the same for Florida, which takes 3 days each way, then I better have space for 60 letters, or risk losing some of the letters permanently.
Let’s see what this looks like in TCP. The Coder CLI includes a speedtest command to test throughput to your workspace, and can capture the TCP packets for analysis in Wireshark. (You will need the Tailscale Wireshark Lua plugin to decode the packet captures.) The following runs a 20 second upload test to my workspace named dogfood2.
Testing with Coder 2.9, I get something like:
I opened one of the packet capture files and asked Wireshark to plot the TCP window (green line) and number of unacknowledged bytes in flight (blue line).
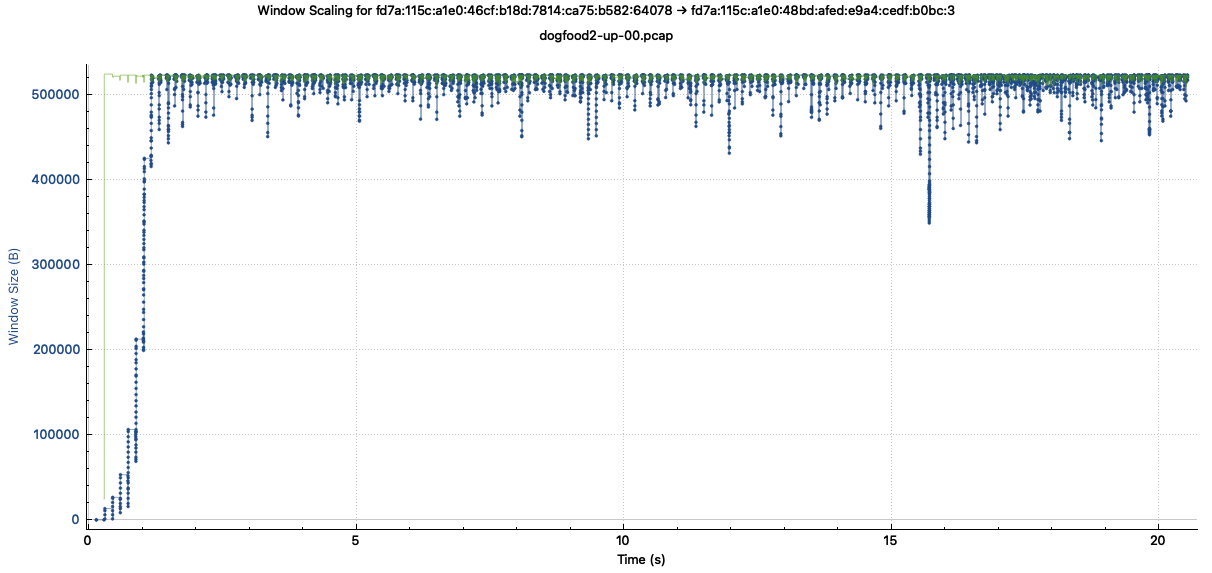
The TCP window is, essentially, how much room the receiver has in its buffer, and the TCP sender is not allowed to send more unacknowledged data than this. When the receiver acknowledges some data, the blue line dips down and we send more. This shows us that the TCP throughput is being limited by the buffer sizes, not the underlying network bandwidth.
The TCP window hovers right around 512 KB, which is one half the default TCP receive buffer size in gVisor. The maximum TCP window is capped at half the buffer to allow for out of order segments and for data not yet delivered to the application.
Increasing the buffers gives the TCP stack the room it needs to track more data in flight, increasing throughput (dramatically in some cases).
On 2.10, which has increased TCP buffers, here is an example speedtest:
When Slow Start is Too Fast
In my performance testing, after increasing buffer sizes I saw much improved throughput overall, but I noticed that my connection speed would often stutter in the first couple seconds.
Here is a Wireshark plot of the TCP throughput for my connection.
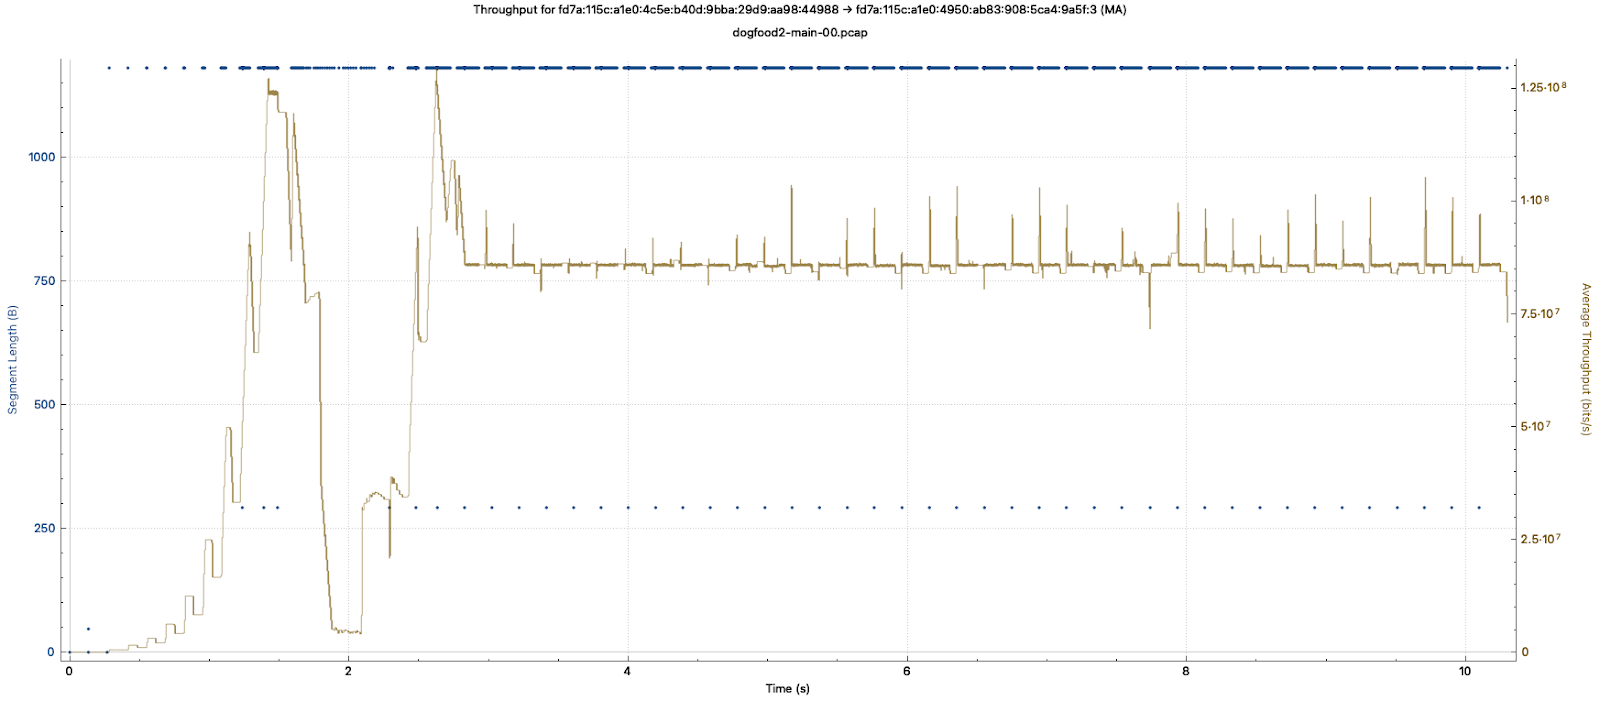
It shows the throughput ramping up in the first second or so, then coming to a screeching halt around 2 seconds, before recovering and stabilizing. This happens even though we never get close to saturating the TCP window we discussed in the last section.
While you’d hardly notice the issue downloading a 100MB file, this stutter would turn a 2 second page load into 3-4 seconds.
To understand what’s happening we need to dive a bit deeper into TCP and talk about congestion control. TCP congestion control algorithms moderate the amount of data a TCP connection sends to avoid overwhelming congested network links along the path. Avoiding this is both in our own selfish interest, since retransmitting dropped packets lowers our effective throughput, and in the common interest of the Internet as a whole because it allows different applications to share the network capacity.
TCP congestion control works by maintaining a second window variable in addition to the one updated by the receiver. The congestion window is an internal state variable that doesn’t appear in the TCP protocol at all. TCP stack takes the smaller of the send window and congestion window to determine an effective window that limits the amount of data it can send.
The full details of congestion control algorithms are beyond the scope of this blog post, but the central idea is that they detect congestion in the network and then update the congestion window, cutting its size in the face of congestion and slowly opening up the window when it seems the network can handle more.
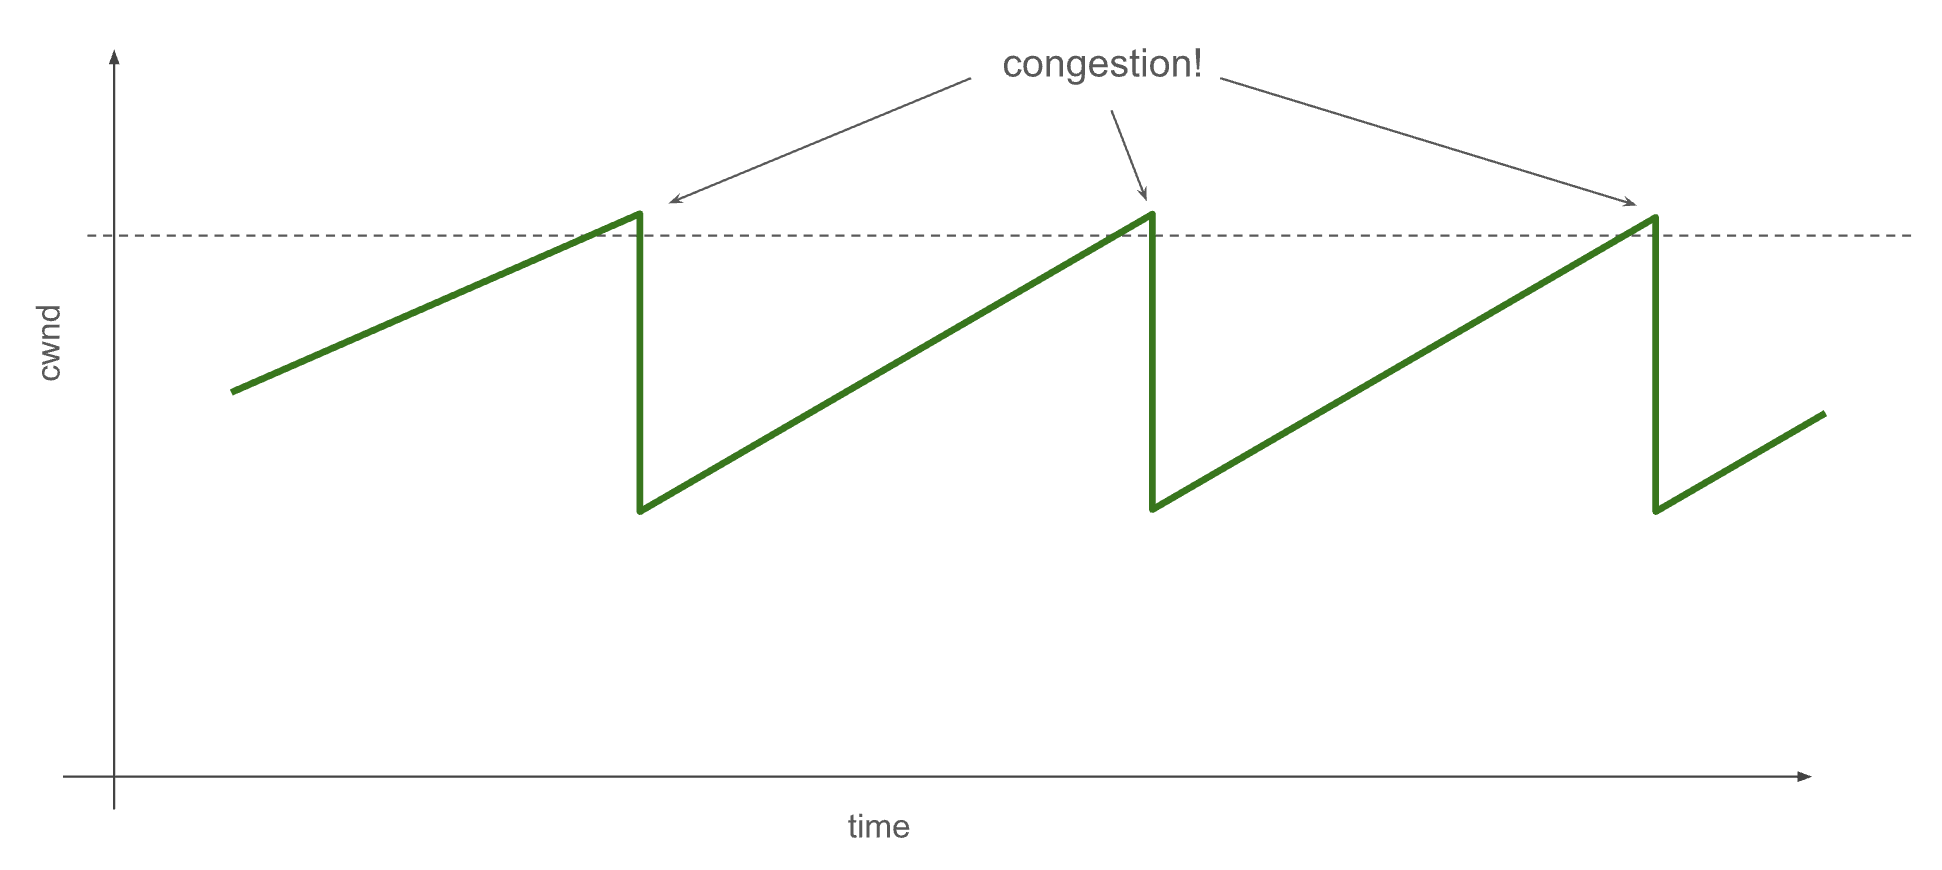
When network links receive more data than they can carry, routers in the path respond to this congestion by dropping packets. TCP detects these packet drops through missed acknowledgements in the protocol. It resends the data, but also reduces the congestion window in response.
At the very start of a TCP connection, the sending stack doesn’t know anything about how much available bandwidth there is on the network path to the destination, so it starts the congestion window very small: just one packet’s worth of data. It does this to avoid dumping a ton of data into the network all at once and causing a cascade of dropped packets. This is called TCP Slow Start.
However, it does not stay slow for long! During TCP Slow Start, each acknowledged packet of data also increases the congestion window, causing 2 packets to be sent in response. This is an exponential increase in throughput–a doubling every round-trip time (RTT). You can see this in the Wireshark throughput plot above during the first second. When TCP detects congestion, it exits Slow Start, having dynamically discovered the current available bandwidth of the network path.
This exponential increase can often be too aggressive. If we depend on a dropped packet to detect congestion, it can take up to one RTT before we receive an indication. During that time, we double the amount of packets we send out into the network, and we might overshoot by a large amount. This is especially a problem for connections with large bandwidth and high latency, as this combination means a large number of packets are “in flight” in the network at any given time. Overshooting can cause a significant fraction of these in flight packets to be dropped. Multiple dropped packets cause a lot of problems for the TCP stack, including slamming the congestion window shut and increased CPU utilization as the stack has to compute which packets to resend. This is the stuttering I saw in my TCP connections.
Fortunately, I’m far from the first person to have noticed this problem. Researchers Ha & Rhee described the issue and an algorithmic solution in their 2011 paper Taming the elephants: New TCP slow start. Their proposed algorithm, called HyStart (short for hybrid start), was eventually implemented in the Linux kernel and a slightly modified version (called HyStart++) implemented in Windows and described in an RFC. HyStart works by tracking slight variations in the round-trip-time to detect network congestion before packets are dropped.
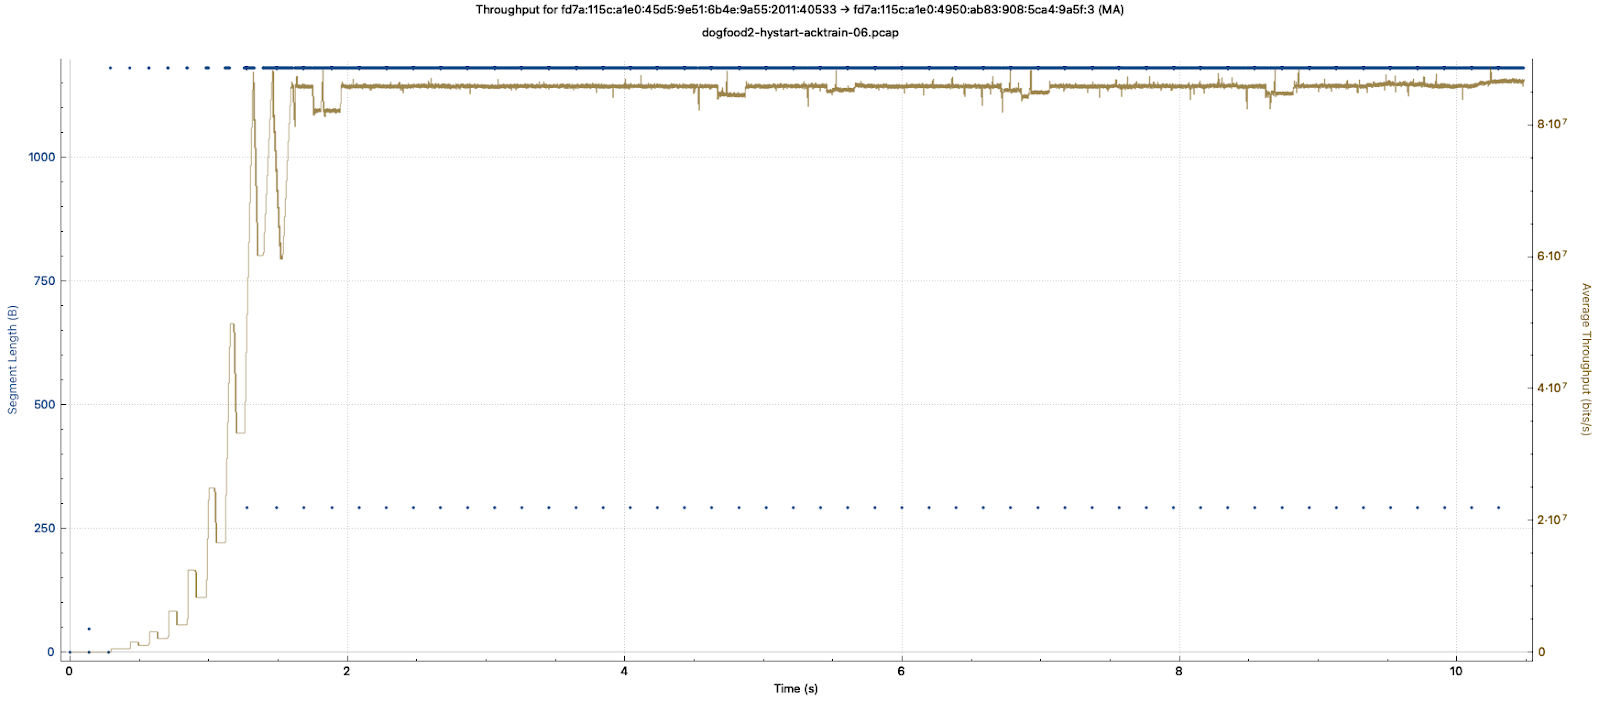
gVisor, the TCP stack we use in Coder, had not implemented HyStart. Google uses gVisor in their data centers, and with extremely short RTTs between nodes, they hadn’t seen the stuttering TCP connections. But, they were very happy to accept a PR when I reached out, and so we implemented and upstreamed HyStart to gVisor earlier this spring. We are pleased to include an updated gVisor TCP stack with HyStart starting in Coder 2.12.
Here is a Wireshark plot of TCP throughput with HyStart implemented:
Packets Lost Within
Networking is a multi-step process with interacting components, many distributed across different locations, and the nature of such systems is that performance is generally limited by a single, slowest rate limiting step, or bottleneck. Furthermore, when you deal with the problem of a rate limiting step, by making it faster or working around it, the performance rapidly improves up to the limits of what was the second-slowest step.
And so, after dealing with TCP buffers and TCP slow start, we continued to examine Coder’s networking performance. We found that TCP throughput was limited by dropped packets, and that some of the packets were being dropped inside the Coder process before they were sent out on the wire!
Coder uses a modified version of Tailscale for networking. The packet-processing pipeline in this arrangement looks, schematically, like this:
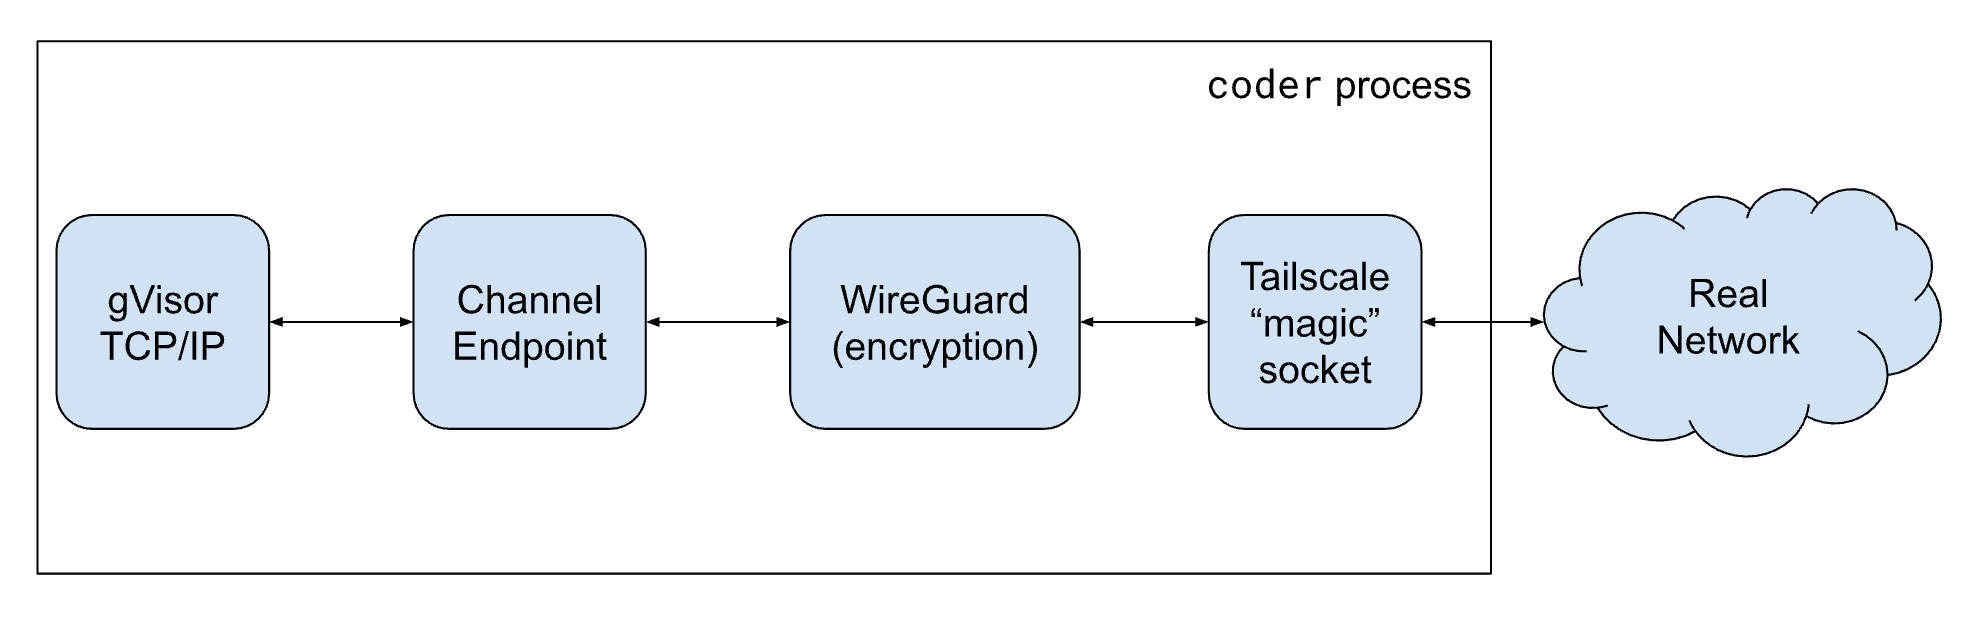
Via some hacked logging, we determined that packets were being dropped in the Channel Endpoint – a software component that looks like a network interface to gVisor and allows WireGuard to read and write network packets like a TUN device.
The Channel Endpoint had an internal queue of packets and when the queue filled up, it dropped packets sent by gVisor’s TCP/IP stack. The Channel Endpoint was a component of gVisor, designed to implement a virtual network link, and dropping packets is what real network links do when they are filled up.
In some sense, this was a reasonable arrangement. If the gVisor stack can send data faster than WireGuard can encrypt, then something needs to put pressure on the stack to get it to back off, and as we discussed in the last section this is exactly what TCP congestion control is designed to do when it detects dropped packets.
However, this is all happening with the same process on a single node, not in some distributed system of interacting routers and switches that make up the Internet. In this context, dropping packets is a very heavyweight solution to the problem of putting back pressure on the TCP stack. Firstly, you have to wait for a network round trip to find out about dropped packets. Secondly, it increases work because you have to resend.
We can do much better, and in fact, Go already includes the data structure we need as a primitive: the buffered channel. A buffered Go channel allows writes to complete without blocking until the buffer is full, and then any further writes simply block until there is room in the channel. This blocks the gVisor stack from sending more data and gives WireGuard time to catch up. And, when WireGuard has caught up, gVisor can resume sending within microseconds, not milliseconds of network round trips. This simple fix doubles throughput on some connections in our test systems.
Final Words
I want to end this post by saying that although we have made big strides in the last few Coder versions, we don’t consider this network performance work done. While security of your data in transit is our top priority, we will continue to push for higher performance until we can say confidently that the bottleneck is the underlying network itself.
1 I’m glossing over the difference between the send buffer and the receive buffer here, and in the case where one is significantly smaller than the other, the maximum throughput is limited by the smaller one.
2 This is by design and is called the end-to-end principle. The services offered by the system are kept basic and lightweight, and if you want reliable delivery, or proof of delivery you build it into the protocols the endpoints speak.

Subscribe to our newsletter
Want to stay up to date on all things Coder? Subscribe to our monthly newsletter for the latest articles, workshops, events, and announcements.