HTTP Resource Leak Mysteries in Go

I love a good leak hunt. It’s an intellectual mystery, and I always learn something new in the process.
This mystery is like you read about or watch on TV: details are salacious, never depressing, and at the end, we always get a nice logical explanation. That’s the great thing about computers: they are ultimately predictable, so I get to play detective secure in the knowledge that I always get my perp.
If you hate mysteries or are coming back for reference, you can skip to the key takeaways (spoiler warning, duh).
Leaky Dog Food
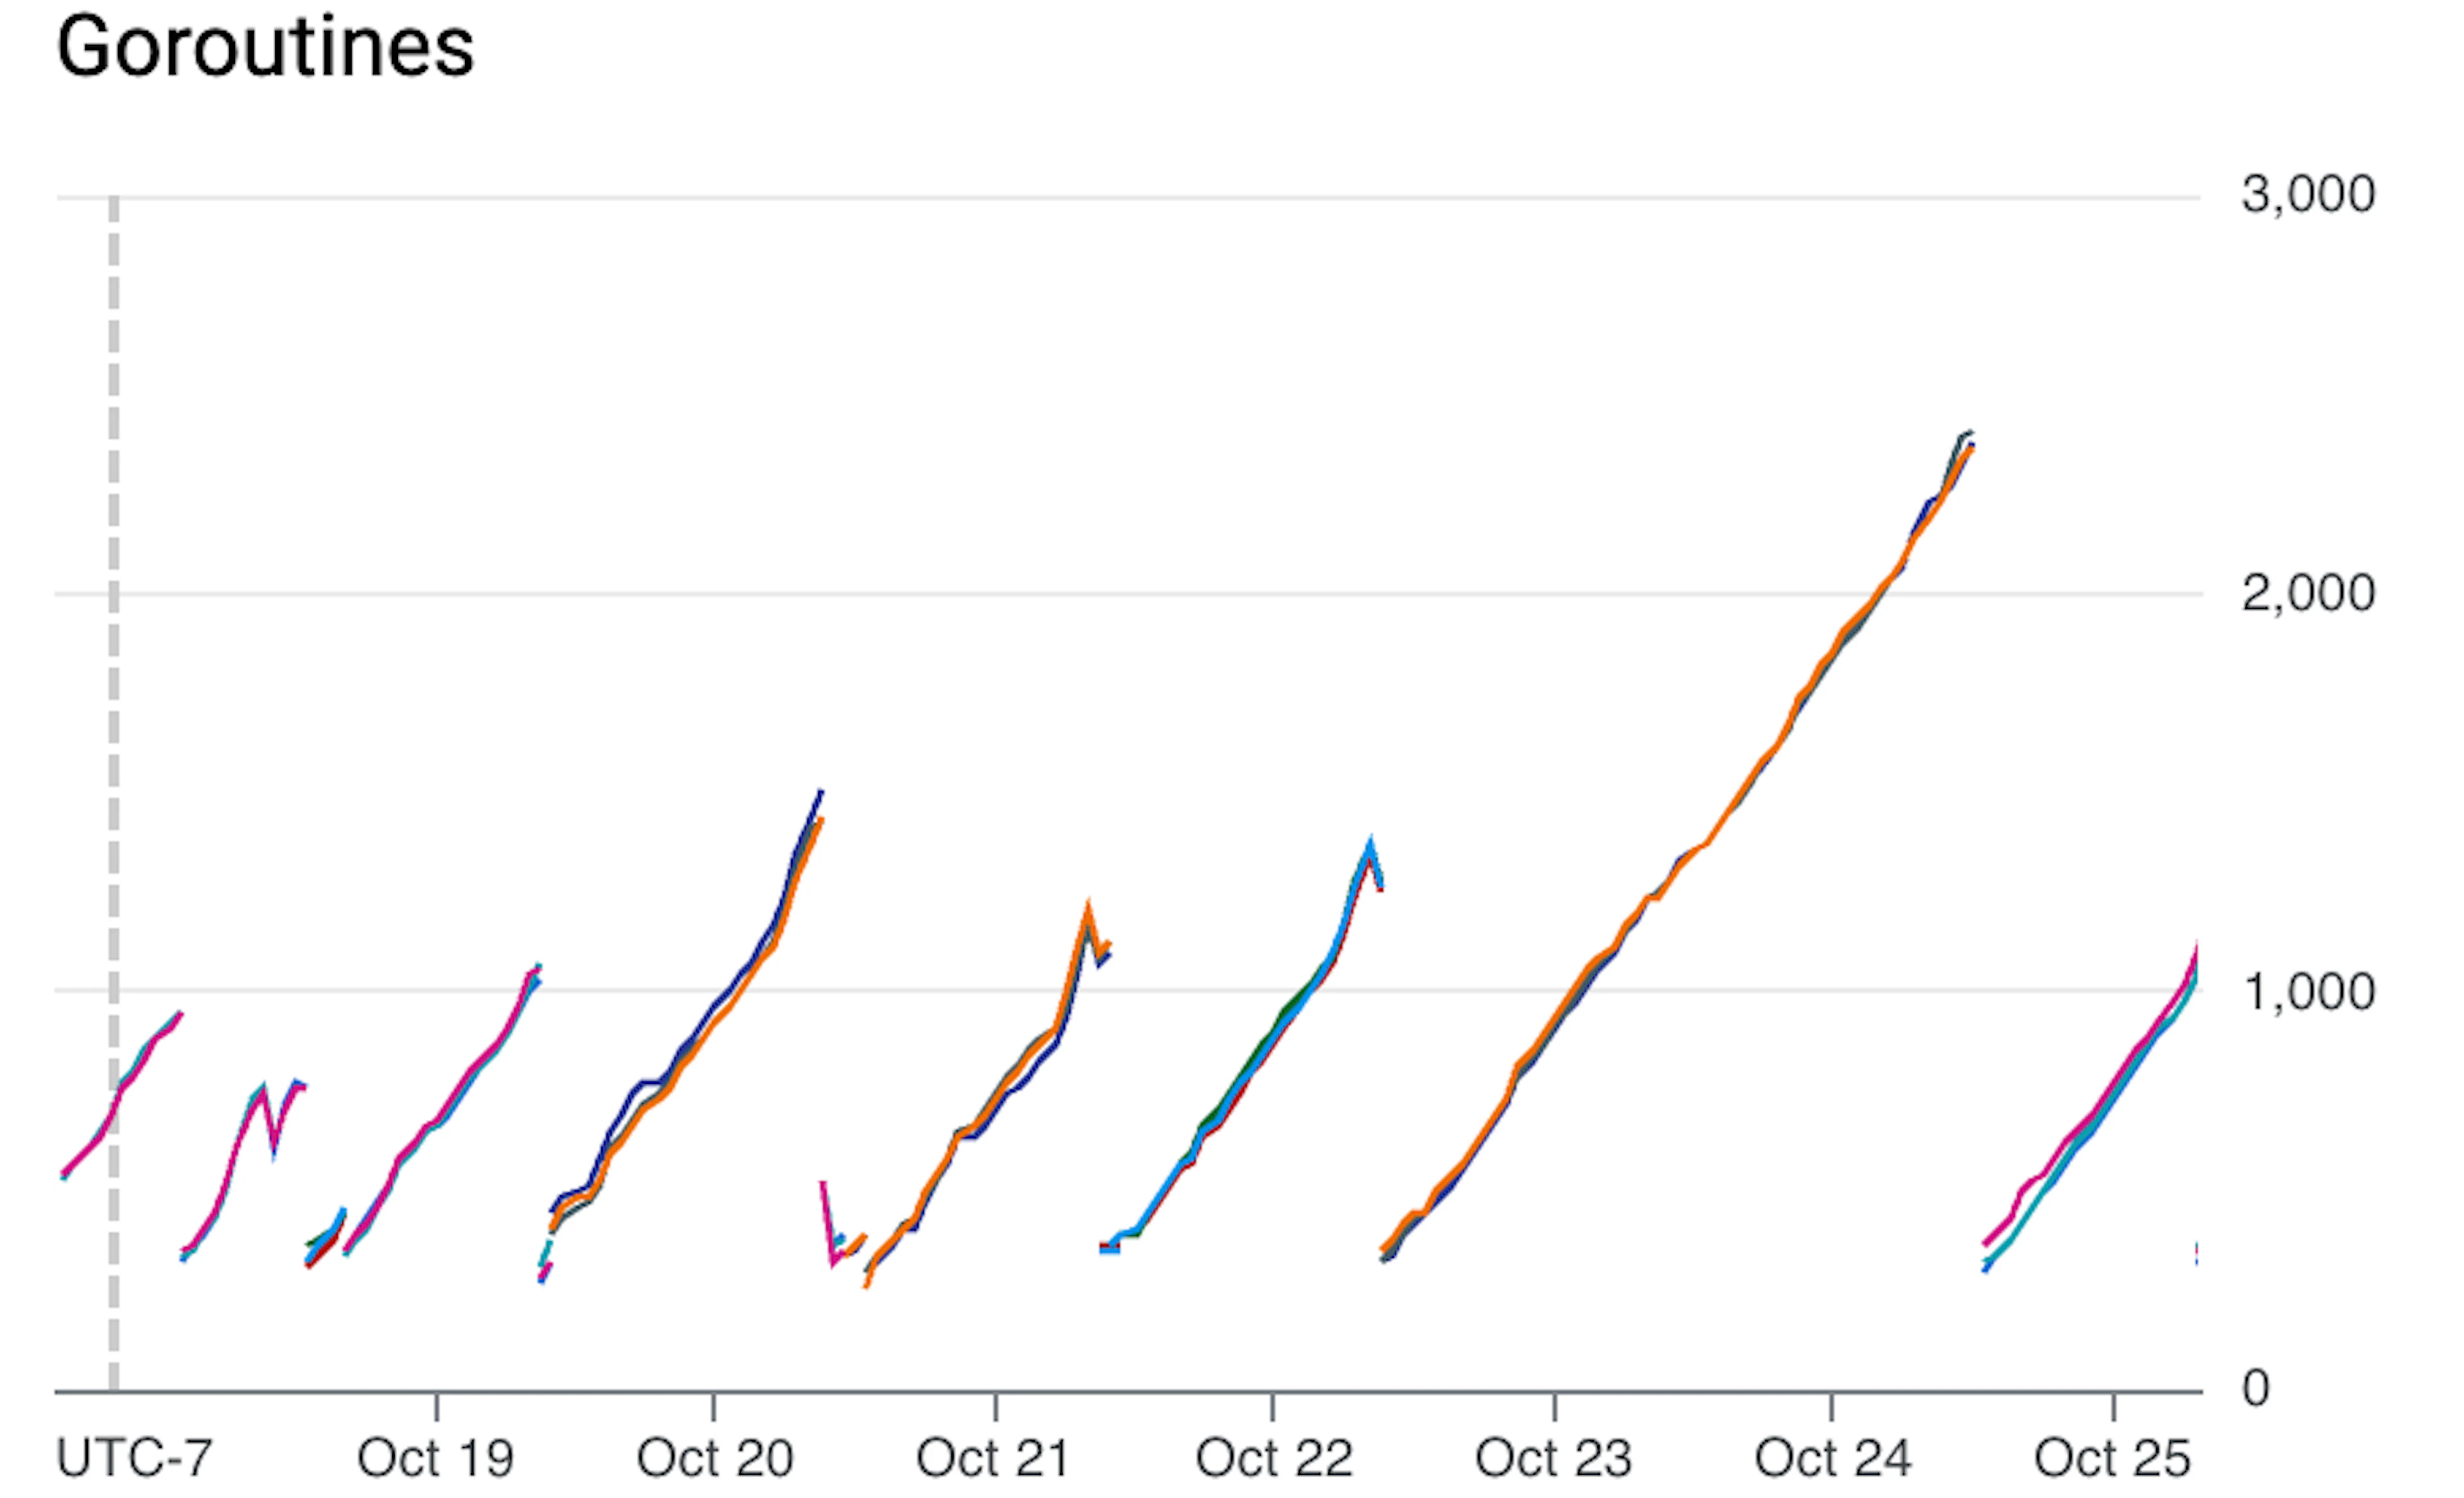
At Coder, we build tools for managing development workspaces in public and private clouds, and of course, we develop Coder on Coder. Last week, an engineer noticed something suspicious in our dogfood[1] cluster’s main coder service, coderd (see above).
The restarts are expected because we re-deploy very aggressively to keep close to the tip of master, but you can see each time we restart we begin a slow but steady climb.
Notice the slope of the climb is constant: it increases at the same rate, day or night. This service is our main API server, and its load is definitely not constant. Like most services, it sees the most load during the workday, and nearly nothing overnight. So, our leak is most likely in some constant background task, rather than an API handler.
Finding Facts
Ok, so let’s learn some more about our leak!
Fortunately, we run our dogfood cluster with golang’s pprof HTTP endpoint. And, we know from metrics we’ve got a goroutine leak, so we can just ask for the stack traces of running goroutines.
At the top of the list, 822 goroutines in a writeLoop and 820 in a readLoop.
Immediately, we can read off that HTTP is involved. It is a persistConn, which, with a little bit of code reading, we can see is used in connection pooling on the client side.
Performance HTTP clients, instead of making a new connection for each HTTP request, maintain a pool of connections to each host. These connections are reused for multiple requests before eventually timing out if idle. This increases request & response throughput for issuing many requests to a host, which is very typical of HTTP client applications.
In our code, we appear to be leaking these connections. But how?
Let’s look at the line we are hanging at on the readLoop goroutines. It’s a select with a nice, helpful comment above it.
So, some code is making an HTTP request, then failing to either cancel the request or finish reading the response body. Usually, this happens when the caller doesn’t call response.Body.Close(). This also explains the writeLoop goroutines, which are created as a pair to the readLoop and are all waiting for a new HTTP request.
Needles in Callstacks
You’d be forgiven for expecting that we are done here. We’ve noticed there is a problem with our metrics, and then used the profiler to track down the exact lines of code that are hanging. Haven’t we solved the mystery?
Well, no. The goroutines we’ve found are working as designed: these guys are the victims, not the perpetrators. The problem is that some other goroutine has made an HTTP request and failed to cancel it or close the response body. And we know the other goroutine(s) are not sitting around waiting for a response, because otherwise we’d see 820 of them in the pprof output. They’ve moved on.
Wouldn’t it be nice to be able to see the call stack where the leaked goroutine was created? You get this kind of output in the go race detector, so it must be technically possible. Clearly it would add some memory overhead to store it on goroutine creation, but it would likely be a few kB per goroutine. Maybe someday we’ll get a runtime mode that includes it, but unfortunately it would not help here. It’s actually easy to track down the line that starts the leaked goroutines, since it’s in the same file. But, remember, this is a persistent connection and it is itself started asynchronously from the HTTP requests that it processes.
No, we need to track down the misbehaving HTTP client code. We know the basic signature of the bug: issue an HTTP request, receive the HTTP response, forget call response.Body.Close(). Our task is gigantic because, simply put HTTP is everywhere. It is the go-to choice for application development protocols. Auditing every HTTP request/response in our codebase would take weeks.
All in the Timing
Recall that our earlier analysis of the metrics led us to conclude it is a background job, and we now know it is one that makes HTTP requests. But we can do better by taking a closer look.
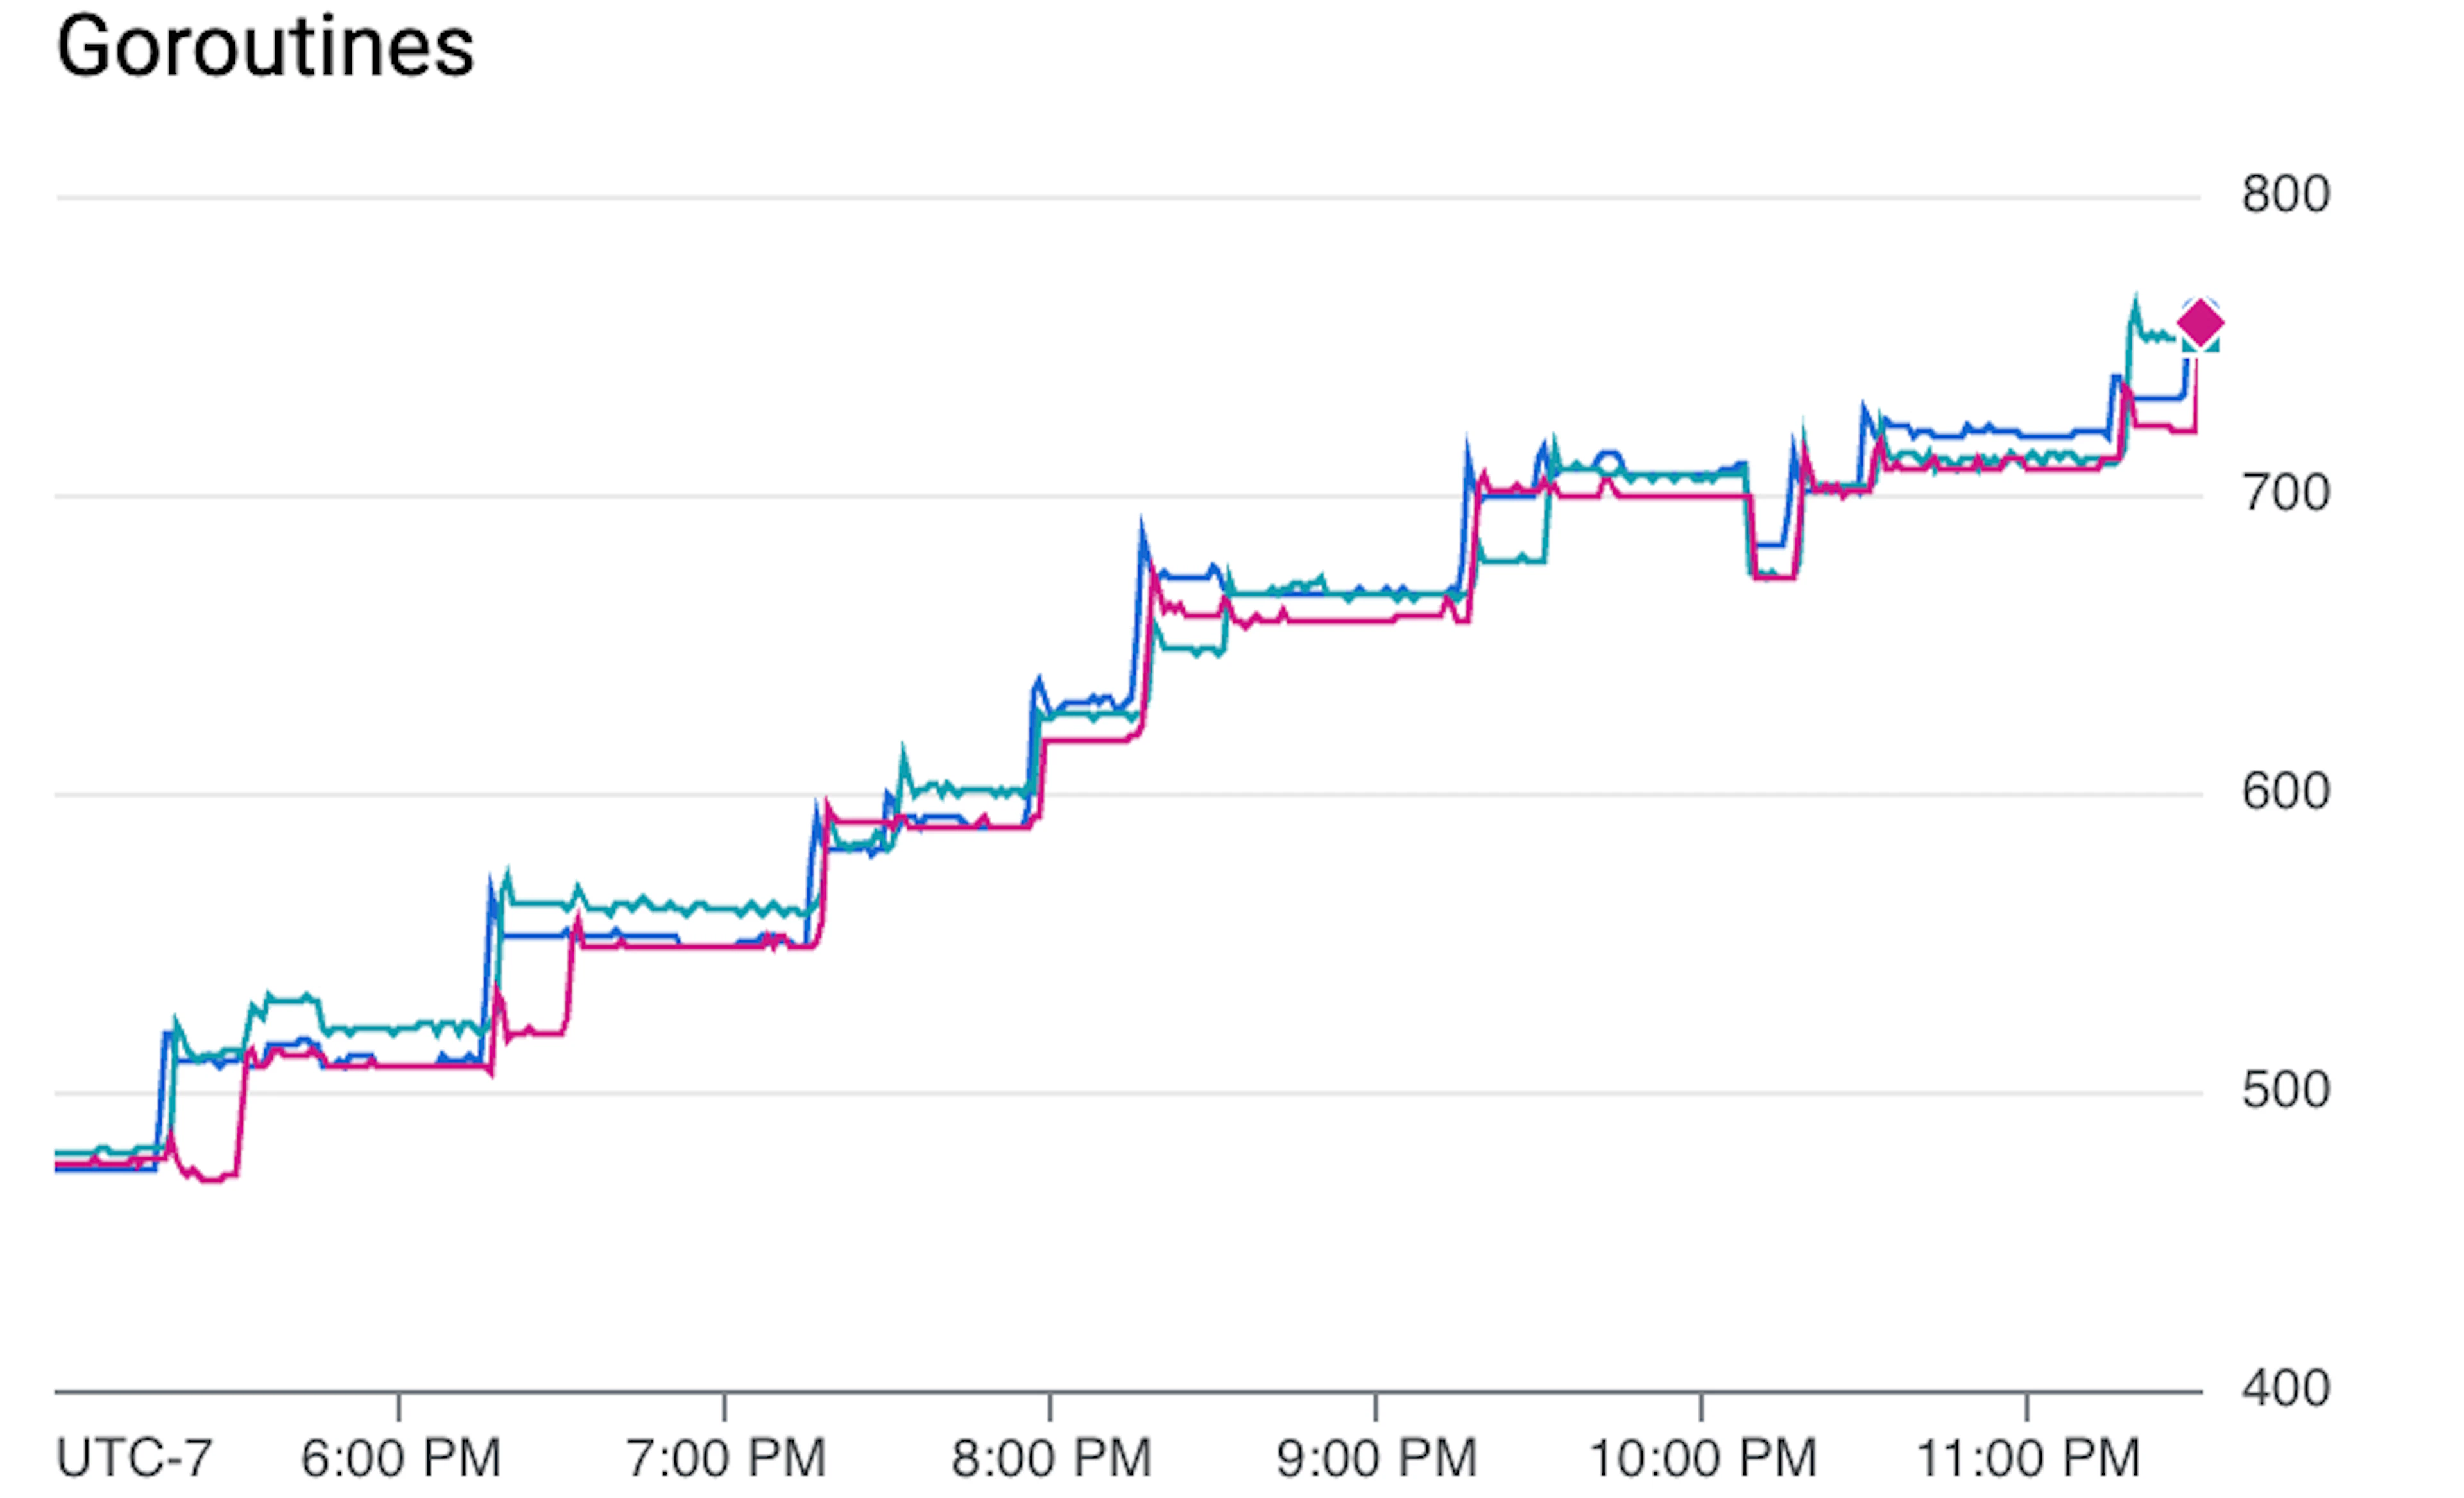
What looked like a straight-line-steady increase is actually stair-stepped, and although there is some noise in the data, it looks like we see a big increase every 1 hour.
It turns out that our coderd service runs 4 background jobs every 1 hour. We have 4 suspects. Which one could it be? Could it be more than one of them? A quick fix to help our sleuthing is to alter the period of the job runs. I could do this one job at a time, but wouldn’t it be nice to make one change that I could leave in place?
The choice of 1 hour intervals is what most people would consider “a nice round number.” But unlike people, computers don’t care about round numbers[2]. 1 hour isn’t an exact value we care about, so it’s fine to change it to something close and not expect the system-wide behavior to be affected.
It’s best to avoid round numbers, in fact the less round, the better. I choose the most “unround” numbers of them all: prime numbers. That makes it mathematically impossible for the period to be some multiple of a more frequent job so they continually happen at the same time. Choose a base unit, and then make your jobs prime numbers times that base unit. I chose 1 minute as the base unit so it will still be easy to read off a metric chart, and because our Prometheus metrics are only scraped every 15 seconds or so, so going much smaller than 1 minute won’t help correlating to metrics. So, my 1 hour jobs become 47, 53, 59, and 67 minutes.
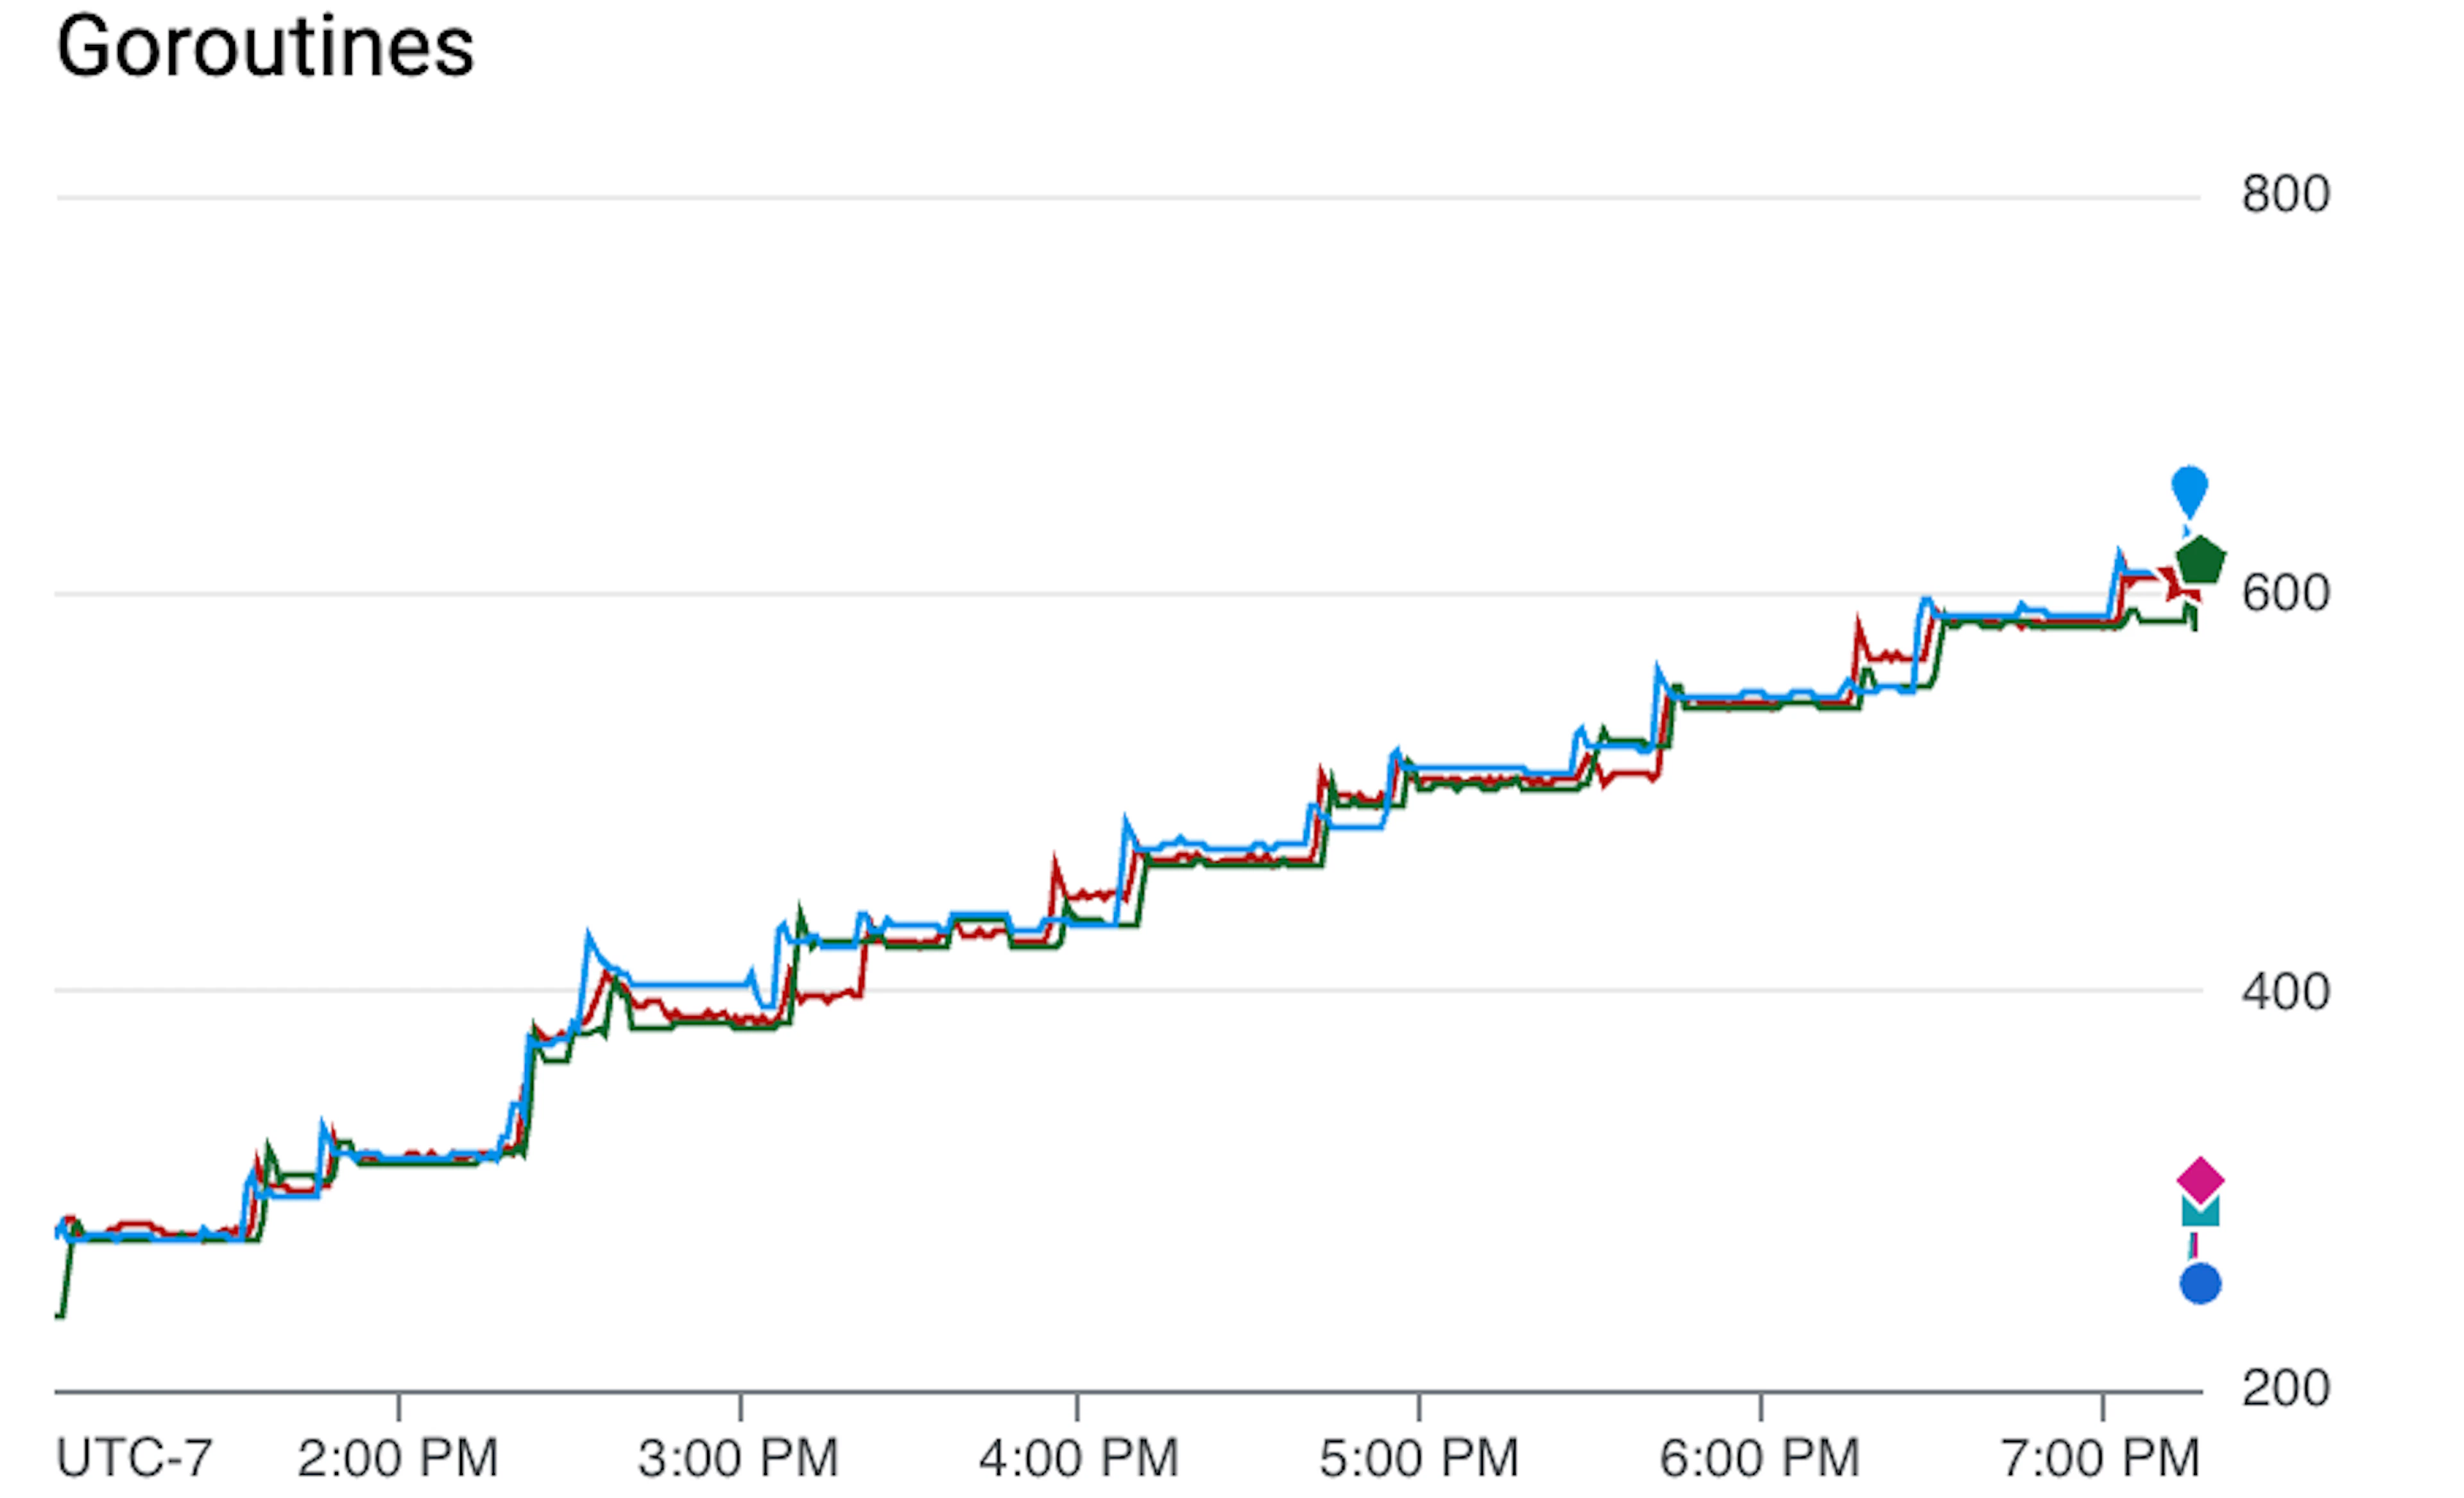
The spikes in goroutines are now mostly 47 minutes apart, although there is still some noise. This extra noise threw me for a loop, and made me wonder whether more than one job was responsible for the leaks. But, the power of choosing prime numbers means that job starts are staggered, and when looking at the peaks alongside metrics that show when jobs start and stop, the peaks always correlated with either the start or the stop of the same job.
So, I have my prime suspect: a job that checks all our workspace container image tags for updates from their respective registries. It’s got motive: HTTP requests to container image registries. It’s got opportunity: I can correlate it, over and over, to the time of the crime.
Interlude: Searching
Above I have described to you the things that I did that actually made progress in my investigation. While doing those things, I was also pounding sand in an activity that did not make progress: reading code.
With a good IDE, you can drill down though call stacks and back up. This is tedious, but I’d like to think I’m pretty good at understanding code and this kind of depth-first search for the buggy code has actually netted me the bug on more than one occasion in the past.
But, as previously mentioned, HTTP is very ubiquitous, so there is a lot of ground to cover, and it’s not always clear when to stop drilling down. Another HTTP request could be just another level down. Alas, it was not to be on this outing.
Tracking it Down
The game is afoot! But, there are still many different code paths. Interacting with a container image registry is a complex interaction involving many HTTP requests.
I also spend some time getting to know the victim. At first glance, they are all John Doe. We don’t know what was being requested when they died. But, on closer inspection of the transport code, the leaked readLoop goroutine turns out to have a reference to the HTTP request it died trying to return the response for. If only I could read that request! I’d know the URL, and it could crack the case wide open.
I could read it if I had it in a debugger.
I try to reproduce the leak in some hastily constructed unit tests, but no luck. It’s not just any container image from just any registry that results in the leak.
Then it dawns on me: I know exactly the set of container images that reproduce the bug. It’s the one in our dogfood cluster. I clone the database so that my testing won’t disrupt other users or delete any data, then run the background job in my own workspace, with debugger, against the cloned data.
Bingo.
Stepping through the job with a debugger, I can see the leaked goroutine. I can read its memory from beyond the grave. From the request URL, I can tell what image it is. The goroutine is no longer John Doe! But, the deed is done and goroutine leaked. I still need to find the perpetrator.
Armed with knowledge of the container image, I run the job one more time, adding some code at the top level that skips everything but the one I know results in the leak. I also add a breakpoint deep in the HTTP transport RoundTripper, so that I will break on every HTTP request. My trap is set and I lay in wait for the perpetrator. I know I’m close.
I click, click, click ahead on my breakpoint as HTTP requests come in, waiting for the exact URL I know to be the trigger. And then, I have it: the callstack where the bug lies.
It’s just as we suspected: a missing response.Body.Close(). The PR with the fix is a one liner. It’s a little poetic, for so much effort, to write a single line of code.
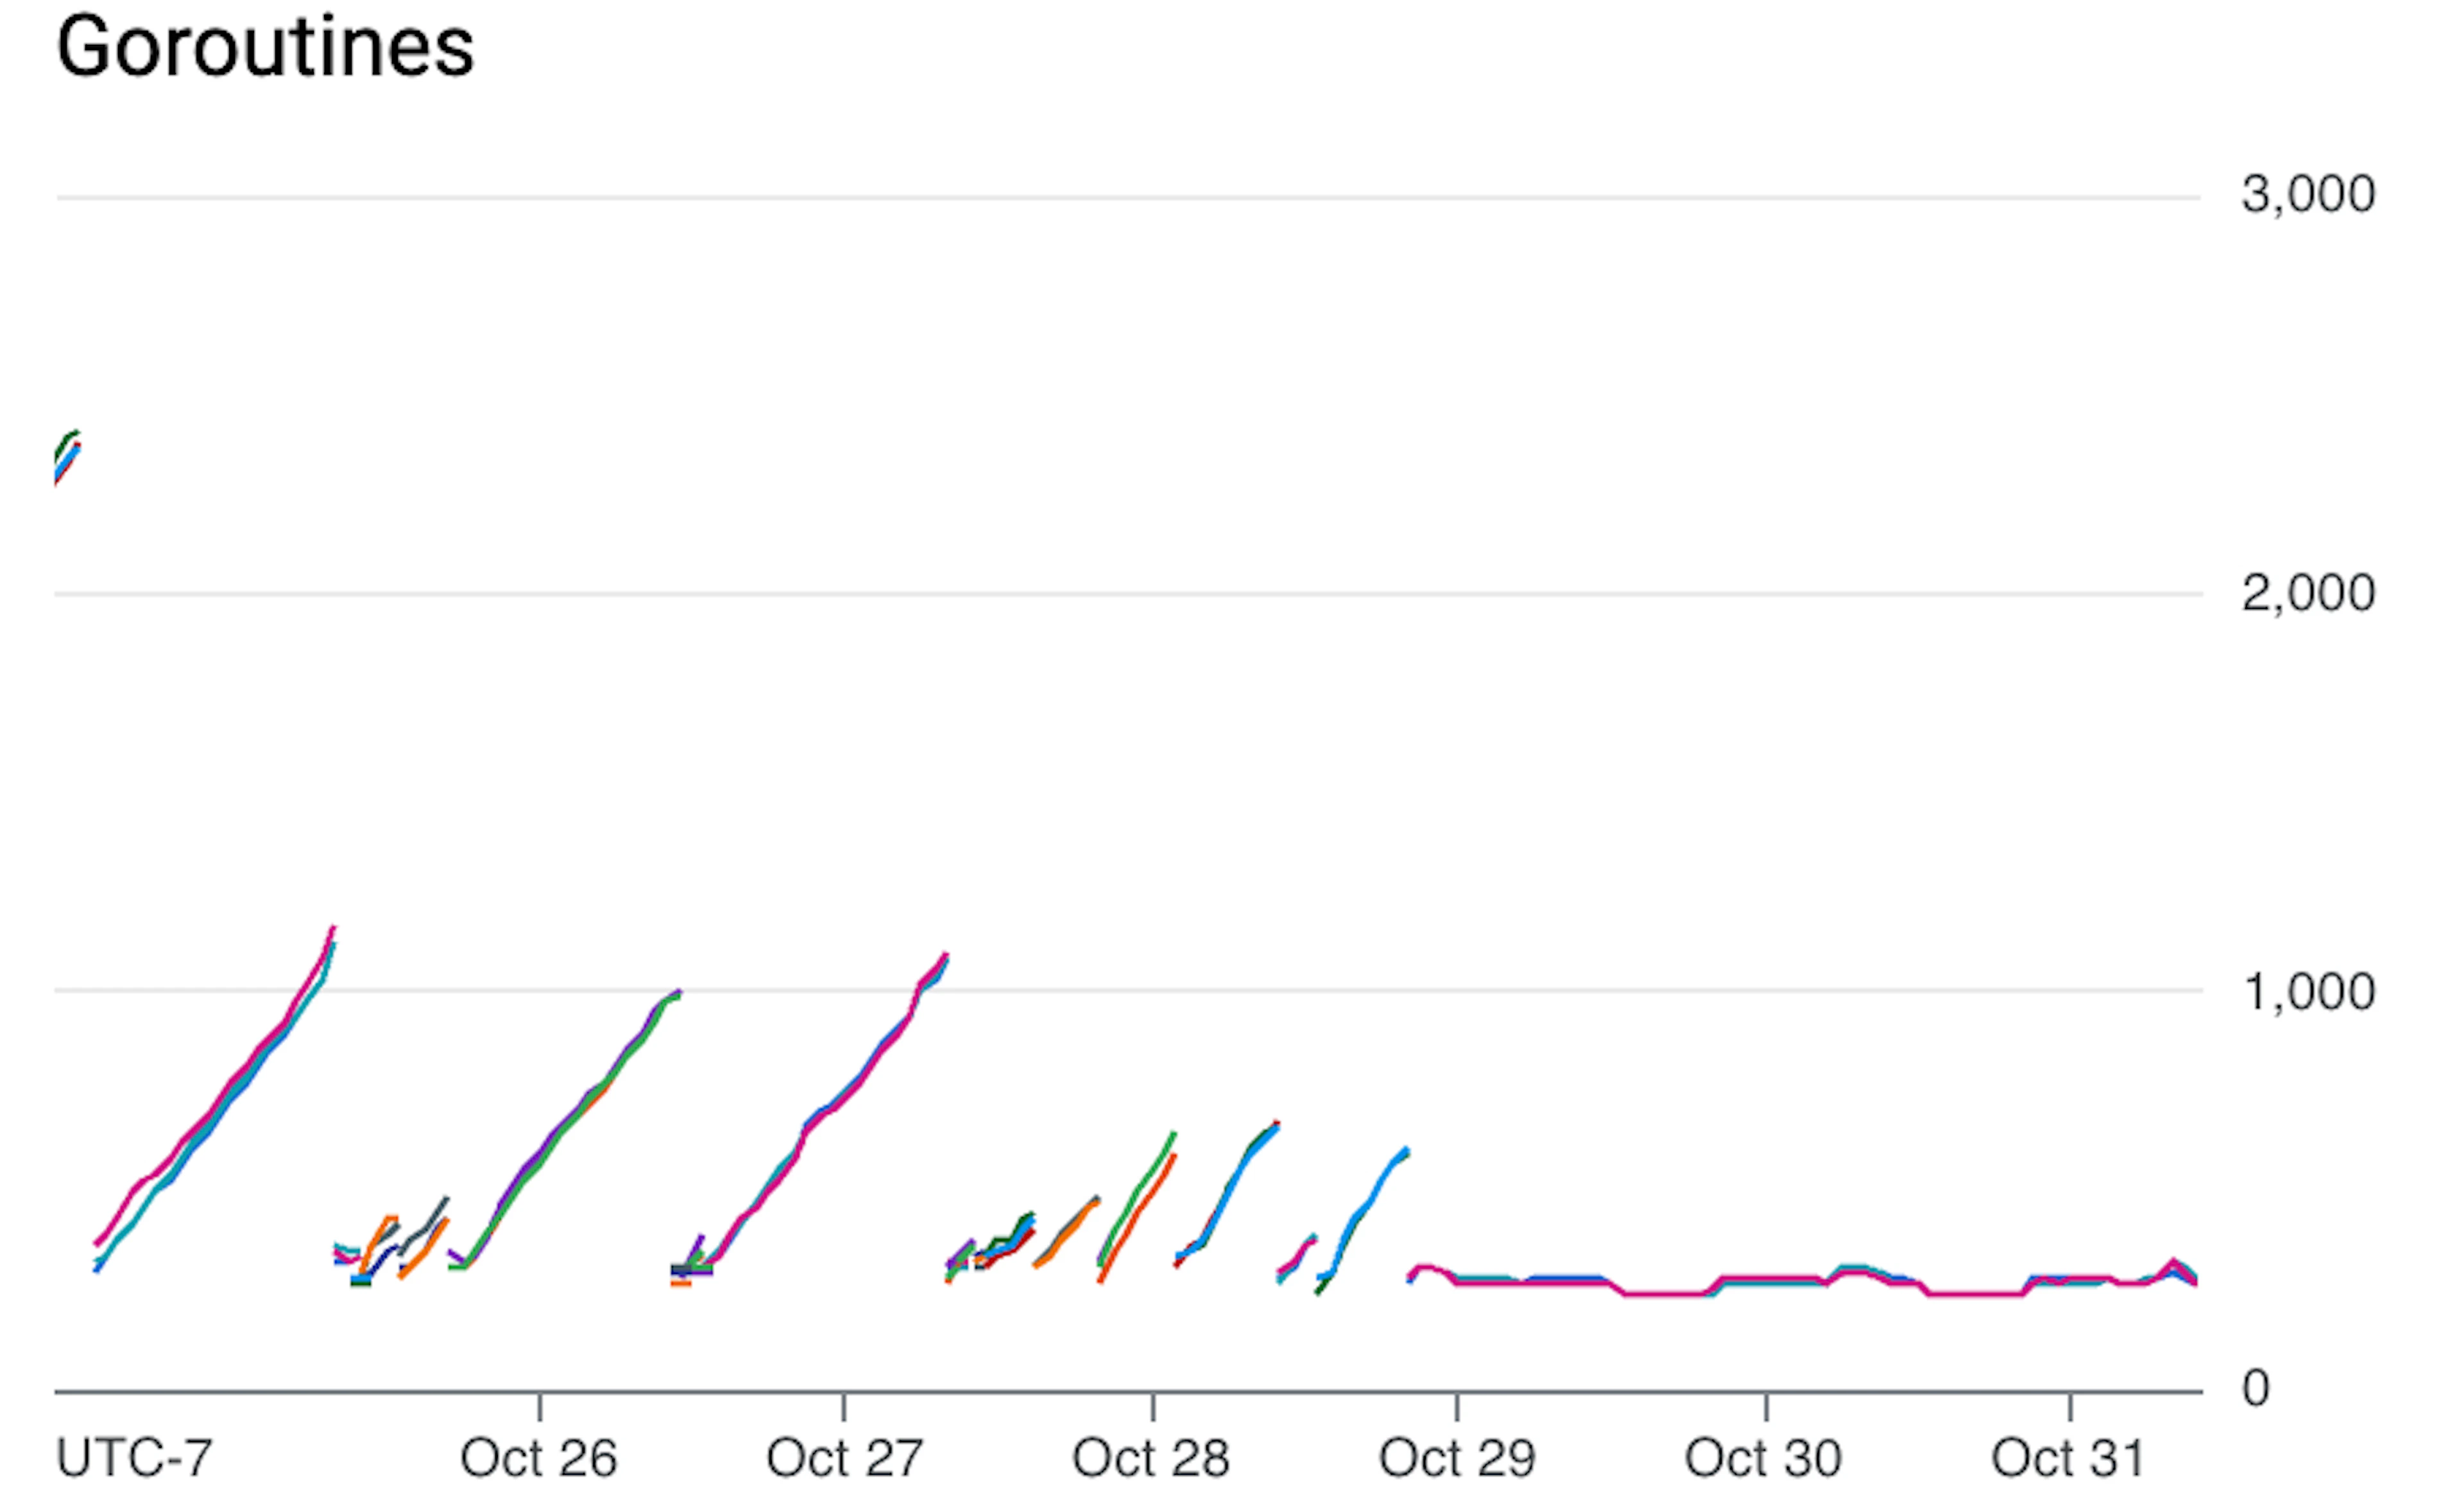
The results speak for themselves.
Key Takeaways
While every leaky code is leaky in its own way, many of the leak detective’s techniques and analytical tools are general.
- Monitor your services for leaks. Key resources to check for every piece of Go software include: a. Memory b. Goroutines c. File descriptors (open files)
- Depending on your application, you might also want to monitor: a. Disk space b. Inodes c. Child processes d. Special resources used by your application (IP Addresses?)
- Look at the rate at which resources are leaked. a. Does the rate correlate to load? Likely related to the request path of your service b. Is the rate independent of load? Likely a background job
- Avoid running all your background jobs on the exact same schedule. Use prime numbers to avoid overlapping job runs.
- Use metrics or logs to record background job start and end times; look for correlations between these times and leaks.
- If you can, export or clone real data to reproduce the problem in your IDE.
On the last point, a word of caution: be careful about cloning production data that includes external customer or user data. Consult with your security team before copying data if you are at all unsure. This is doubly true if you operate in a regulated industry (finance, healthcare, etc.) or are a spy.
[1] Using your own product is colloquially known as dogfooding, as in, “eating your own dog food.” [2] And, they have a different idea of what counts as round.
Subscribe to our newsletter
Want to stay up to date on all things Coder? Subscribe to our monthly newsletter for the latest articles, workshops, events, and announcements.
