


When you build developer infrastructure that thousands of engineers depend on, your own development environment has to hold up under pressure. At Coder, we use Coder to build Coder. That means our developers work on large shared machines with significant CPU and memory, and running Go's parallel test suite to shorten the inner code-test loop. That setup comes with real advantages. It also comes with costs, and one of them quietly compounded for years before we finally dealt with it.
By late 2025, running make test consumed nearly 25GB of memory. Enough to put strain even on our large development machines and slow down every engineer working on the platform. This kind of problem doesn't announce itself — it just gradually makes everything a little worse until you stop and ask why.
This post walks through how we tracked down the root cause, what we found, and how a two-line fix delivered a 70% reduction in test memory.
Starting the investigation
We had an initial hunch that maybe the memory allocations were attributable to Postgres, but it’s important to avoid drawing conclusions too early. We clone a fresh database on a real Postgres server for each of our integration-style test cases. Since our database was containerized in Docker for testing, we could monitor its memory usage on the CLI using docker stats.
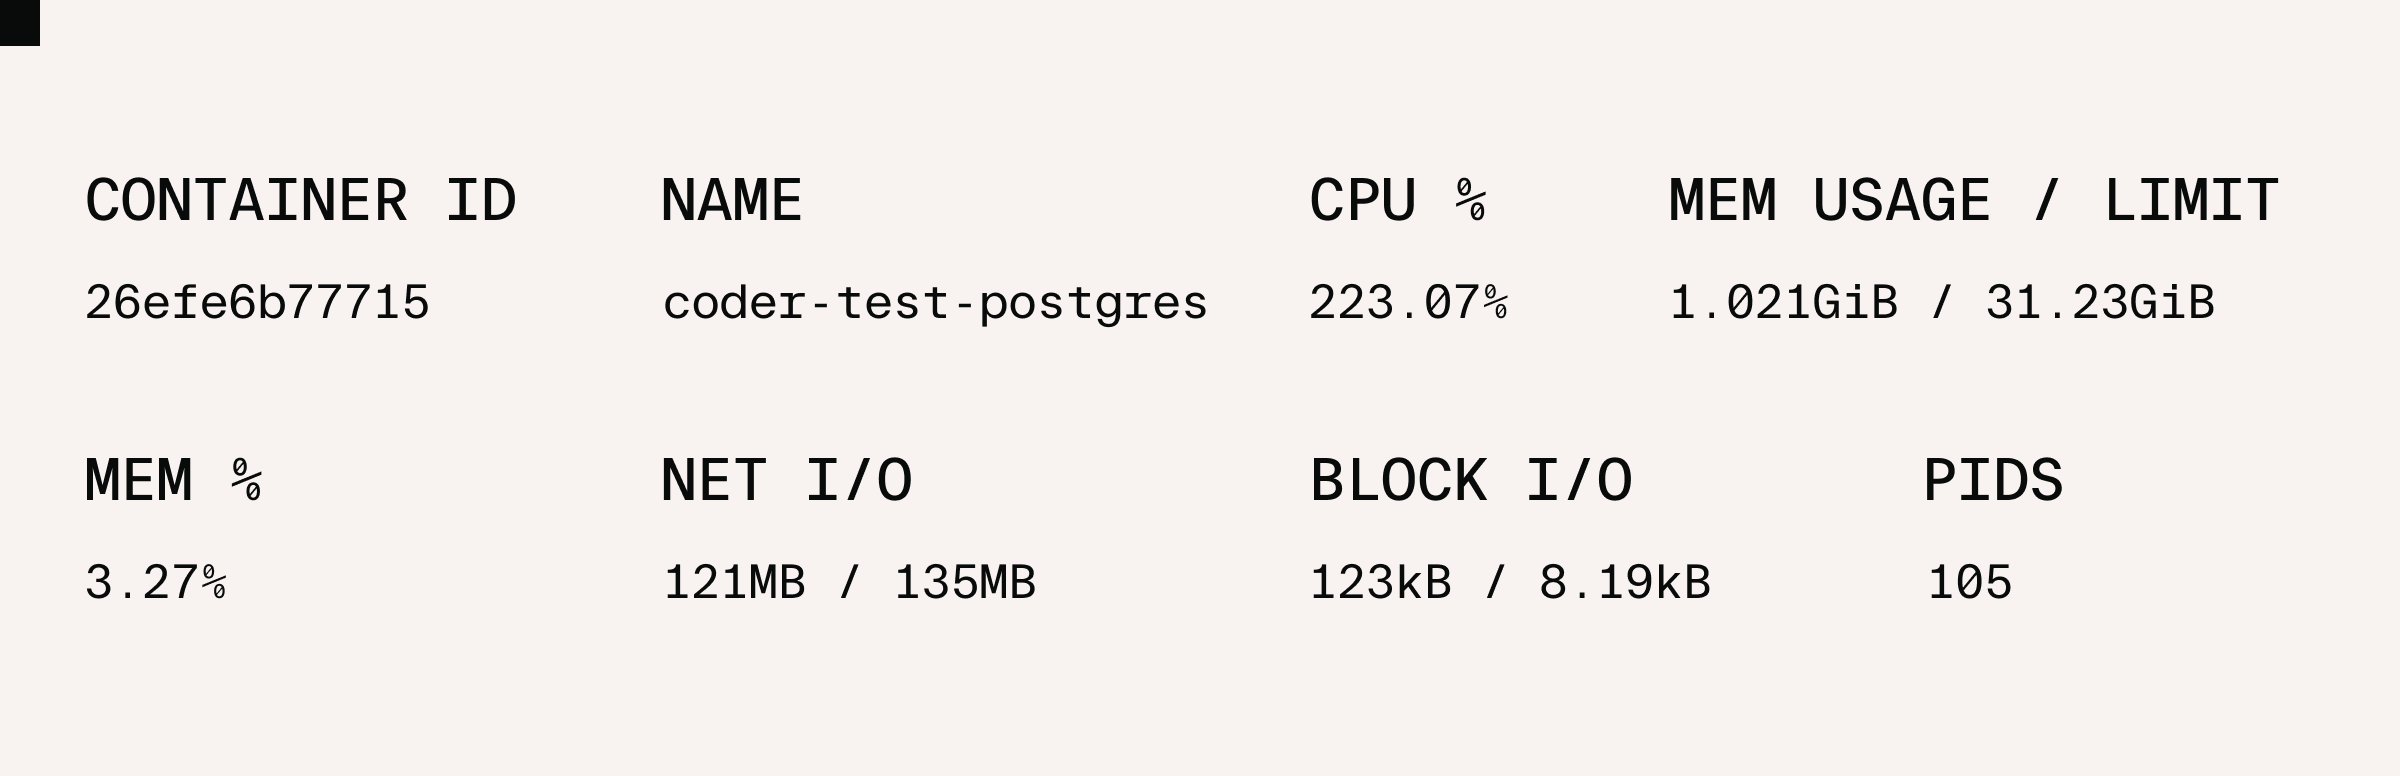
While 1GB is nothing to sneeze at, it was a far cry from the observed 25GB in use looking at system stats. With Postgres exonerated, we turned to the Go tests themselves.
Using top to monitor memory by process:
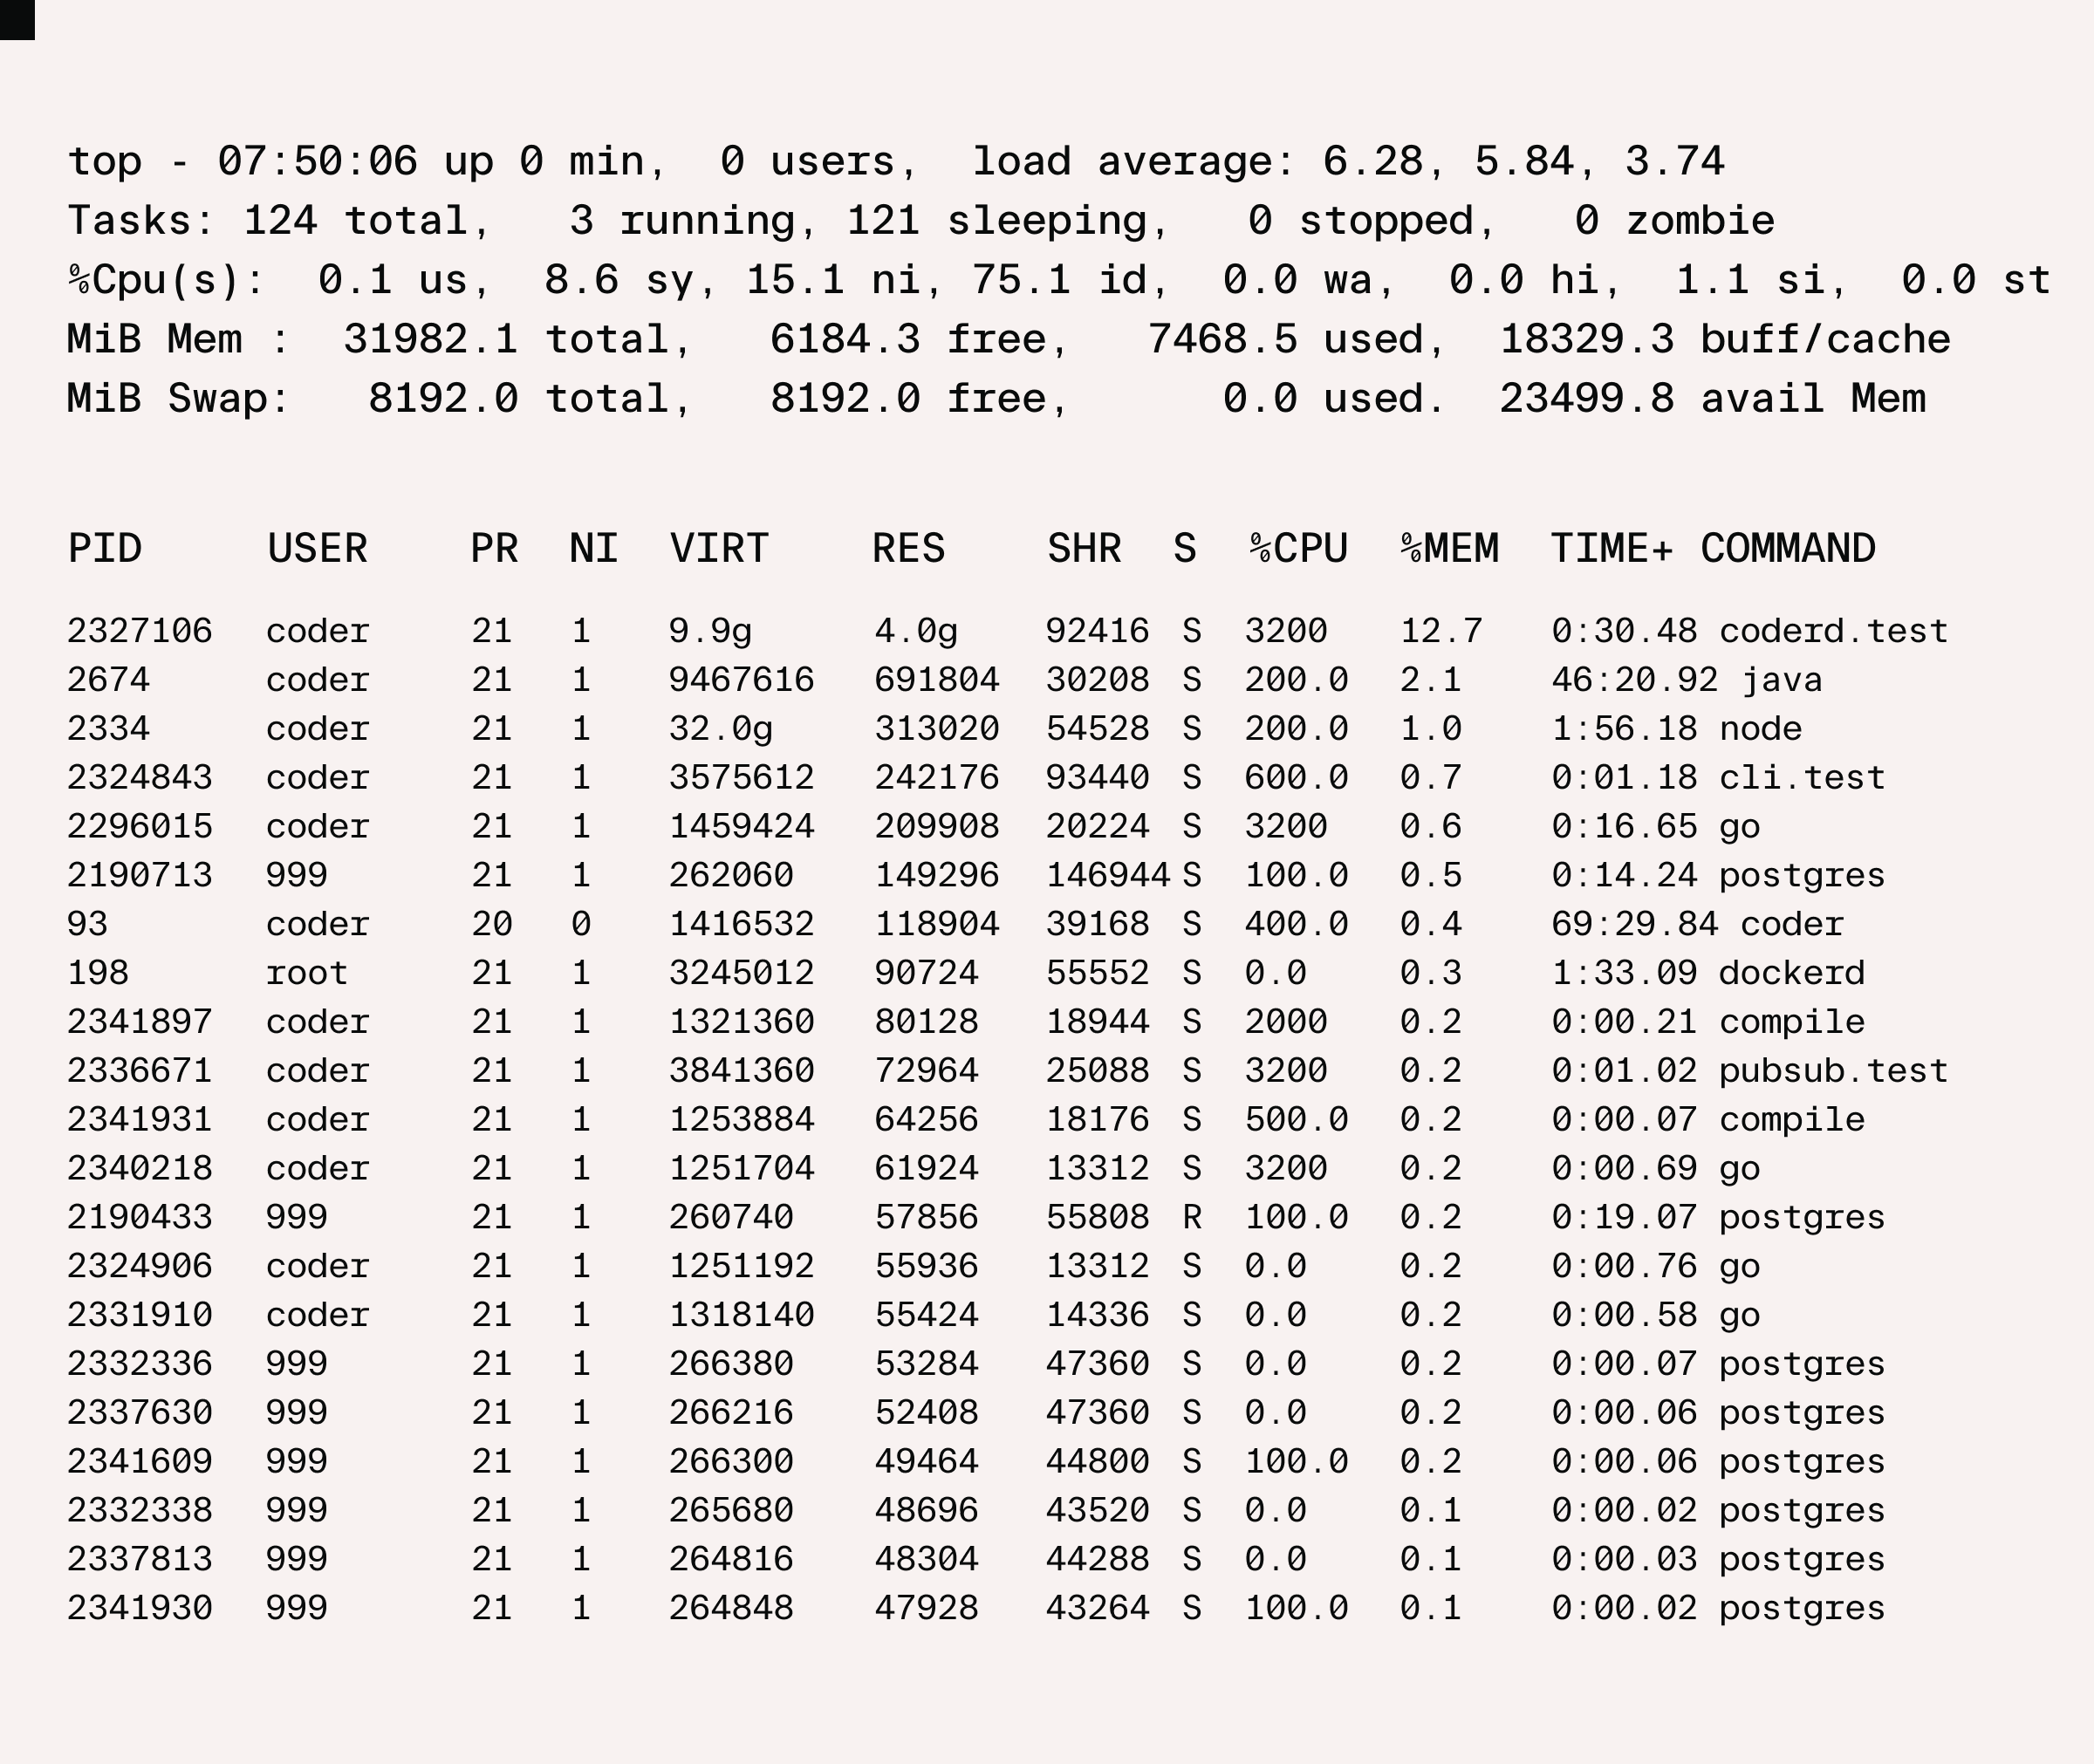
We could see different Go modules executing in parallel, some of which, like coderd.test in this example, using multiple GB on their own. Across multiple packages this is where the majority of the memory was being used.
Profiling the memory
The next step was to get even more precise. We profiled where the memory is being used by our tests by using Go’s built-in -memprofile flag, like this:
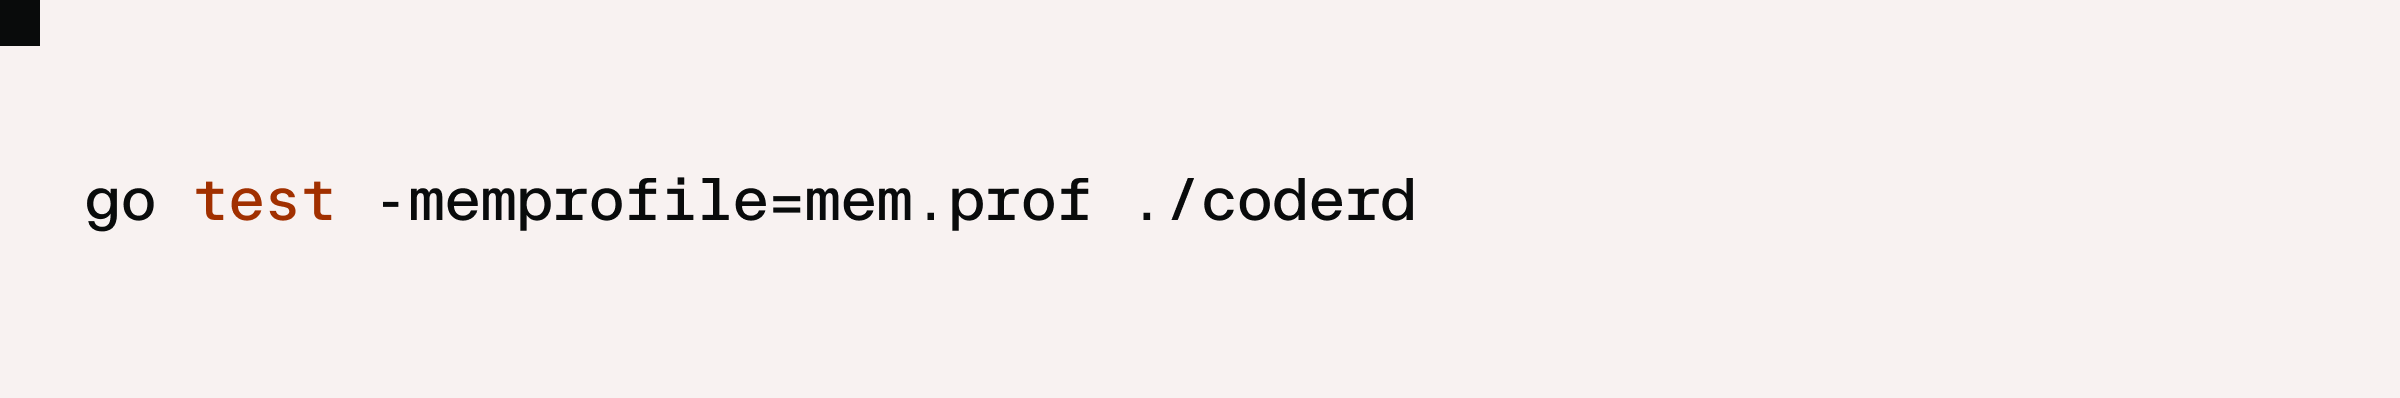
From there, we used the go tool pprof to inspect the memory profile. The Top view shows function calls ranked by memory usage, and the answer was immediate: roughly 71% of the in-use memory, that is, multiple GB, was for Wireguard message buffers.
To understand why, you need to understand how Coder uses Wireguard both in production and in testing.
How Wireguard fits into Coder
We encrypt all packets to and from Coder workspaces using Wireguard. In production instances of the Coder Server, Workspace Agent, Workspace Proxies, and the CLI, we run a single Wireguard device instance in the process, even if we connect to multiple Workspaces as the Server and Workspace Proxies do.
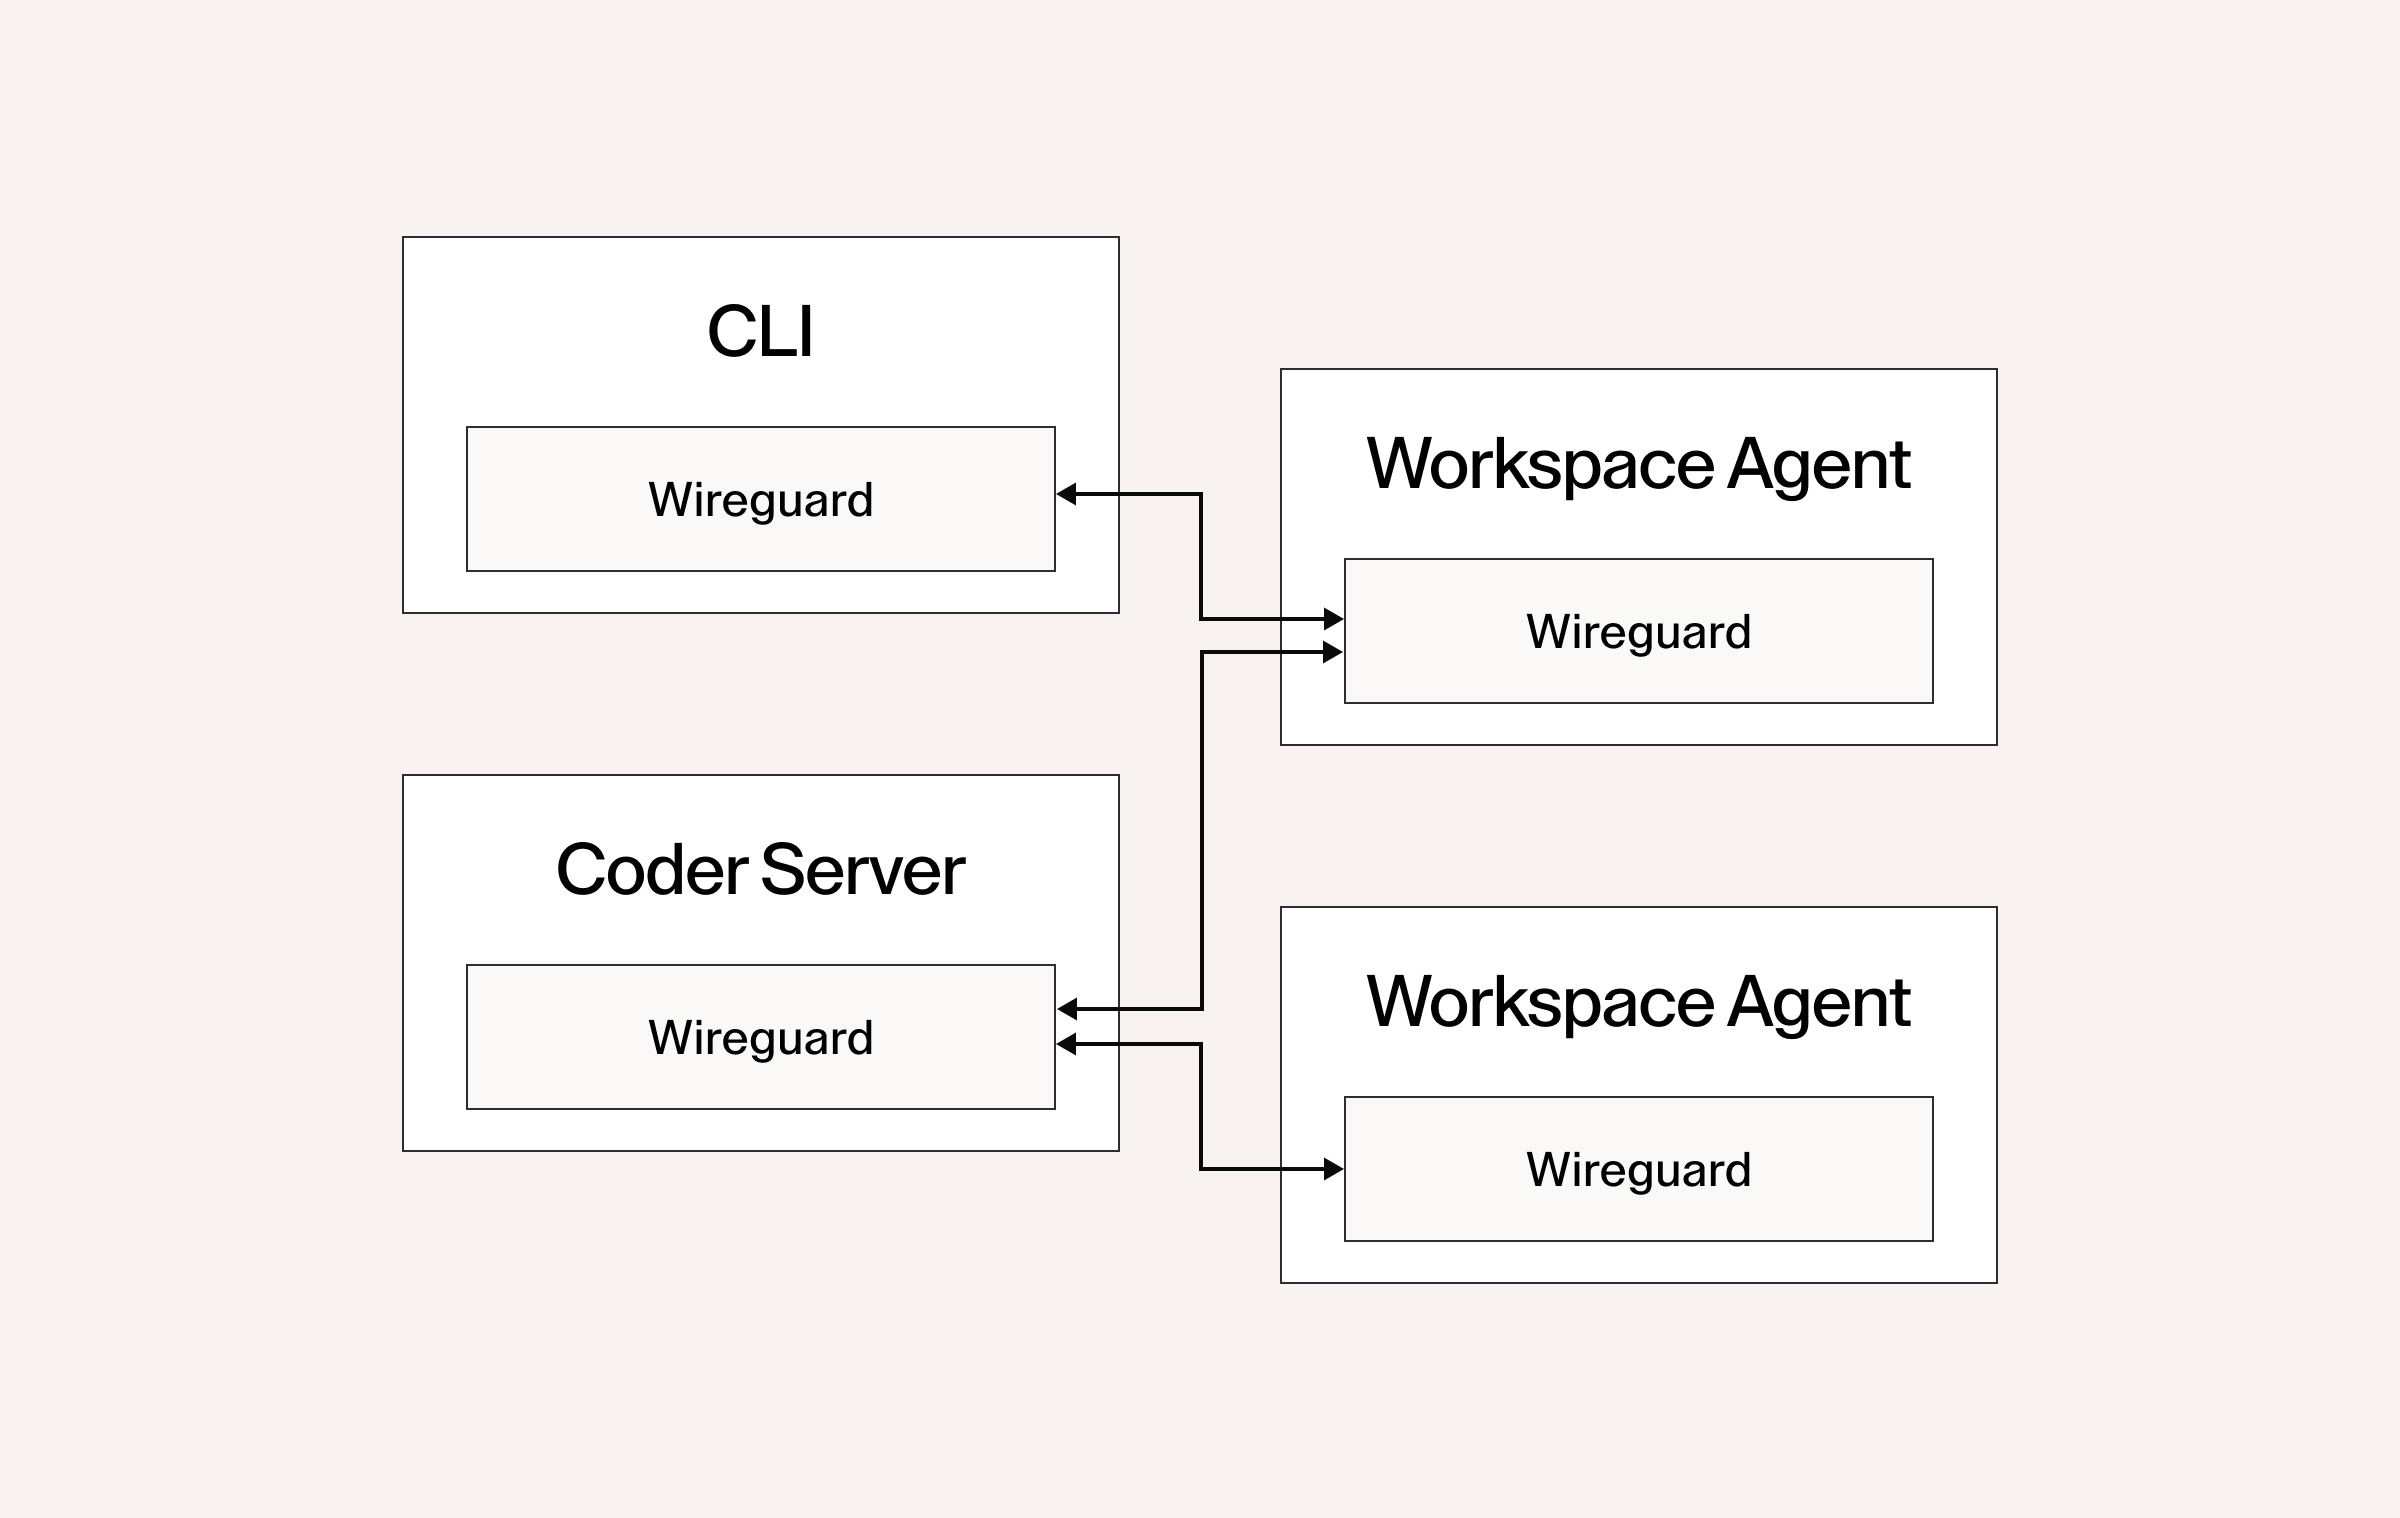
In testing, however, the picture looks very different. We have a large number of integration-style tests that create a Coder Server, complete with a Wireguard device. In some of these tests we also create Workspace Agents or CLI instances that create additional Wireguard devices. Thus, each of these tests creates 1-3 Wireguard devices. The largest packages have nearly 1000 integration-style test cases like this.
In our case, it was not any recent change that caused a large spike in memory usage. Automated software testing is a cumulative process, and over the years, like a frog in a pot of water slowly heating up, we didn’t take notice of the ever-increasing peak memory usage.
Understanding the allocation
Wireguard encrypts individual IP packets and then encapsulates them in UDP for transmission over the network. In order to read incoming UDP packets on a socket, the owning process allocates memory buffers from its own address space, then calls into the OS kernel to ask it to write the incoming packets to the buffer. This creates overhead in switching from user-mode to kernel-mode execution, and so for high performance this request can be batched. The stack trace we saw in our pprof view is Wireguard allocating these buffers for batched reads from the operating system.
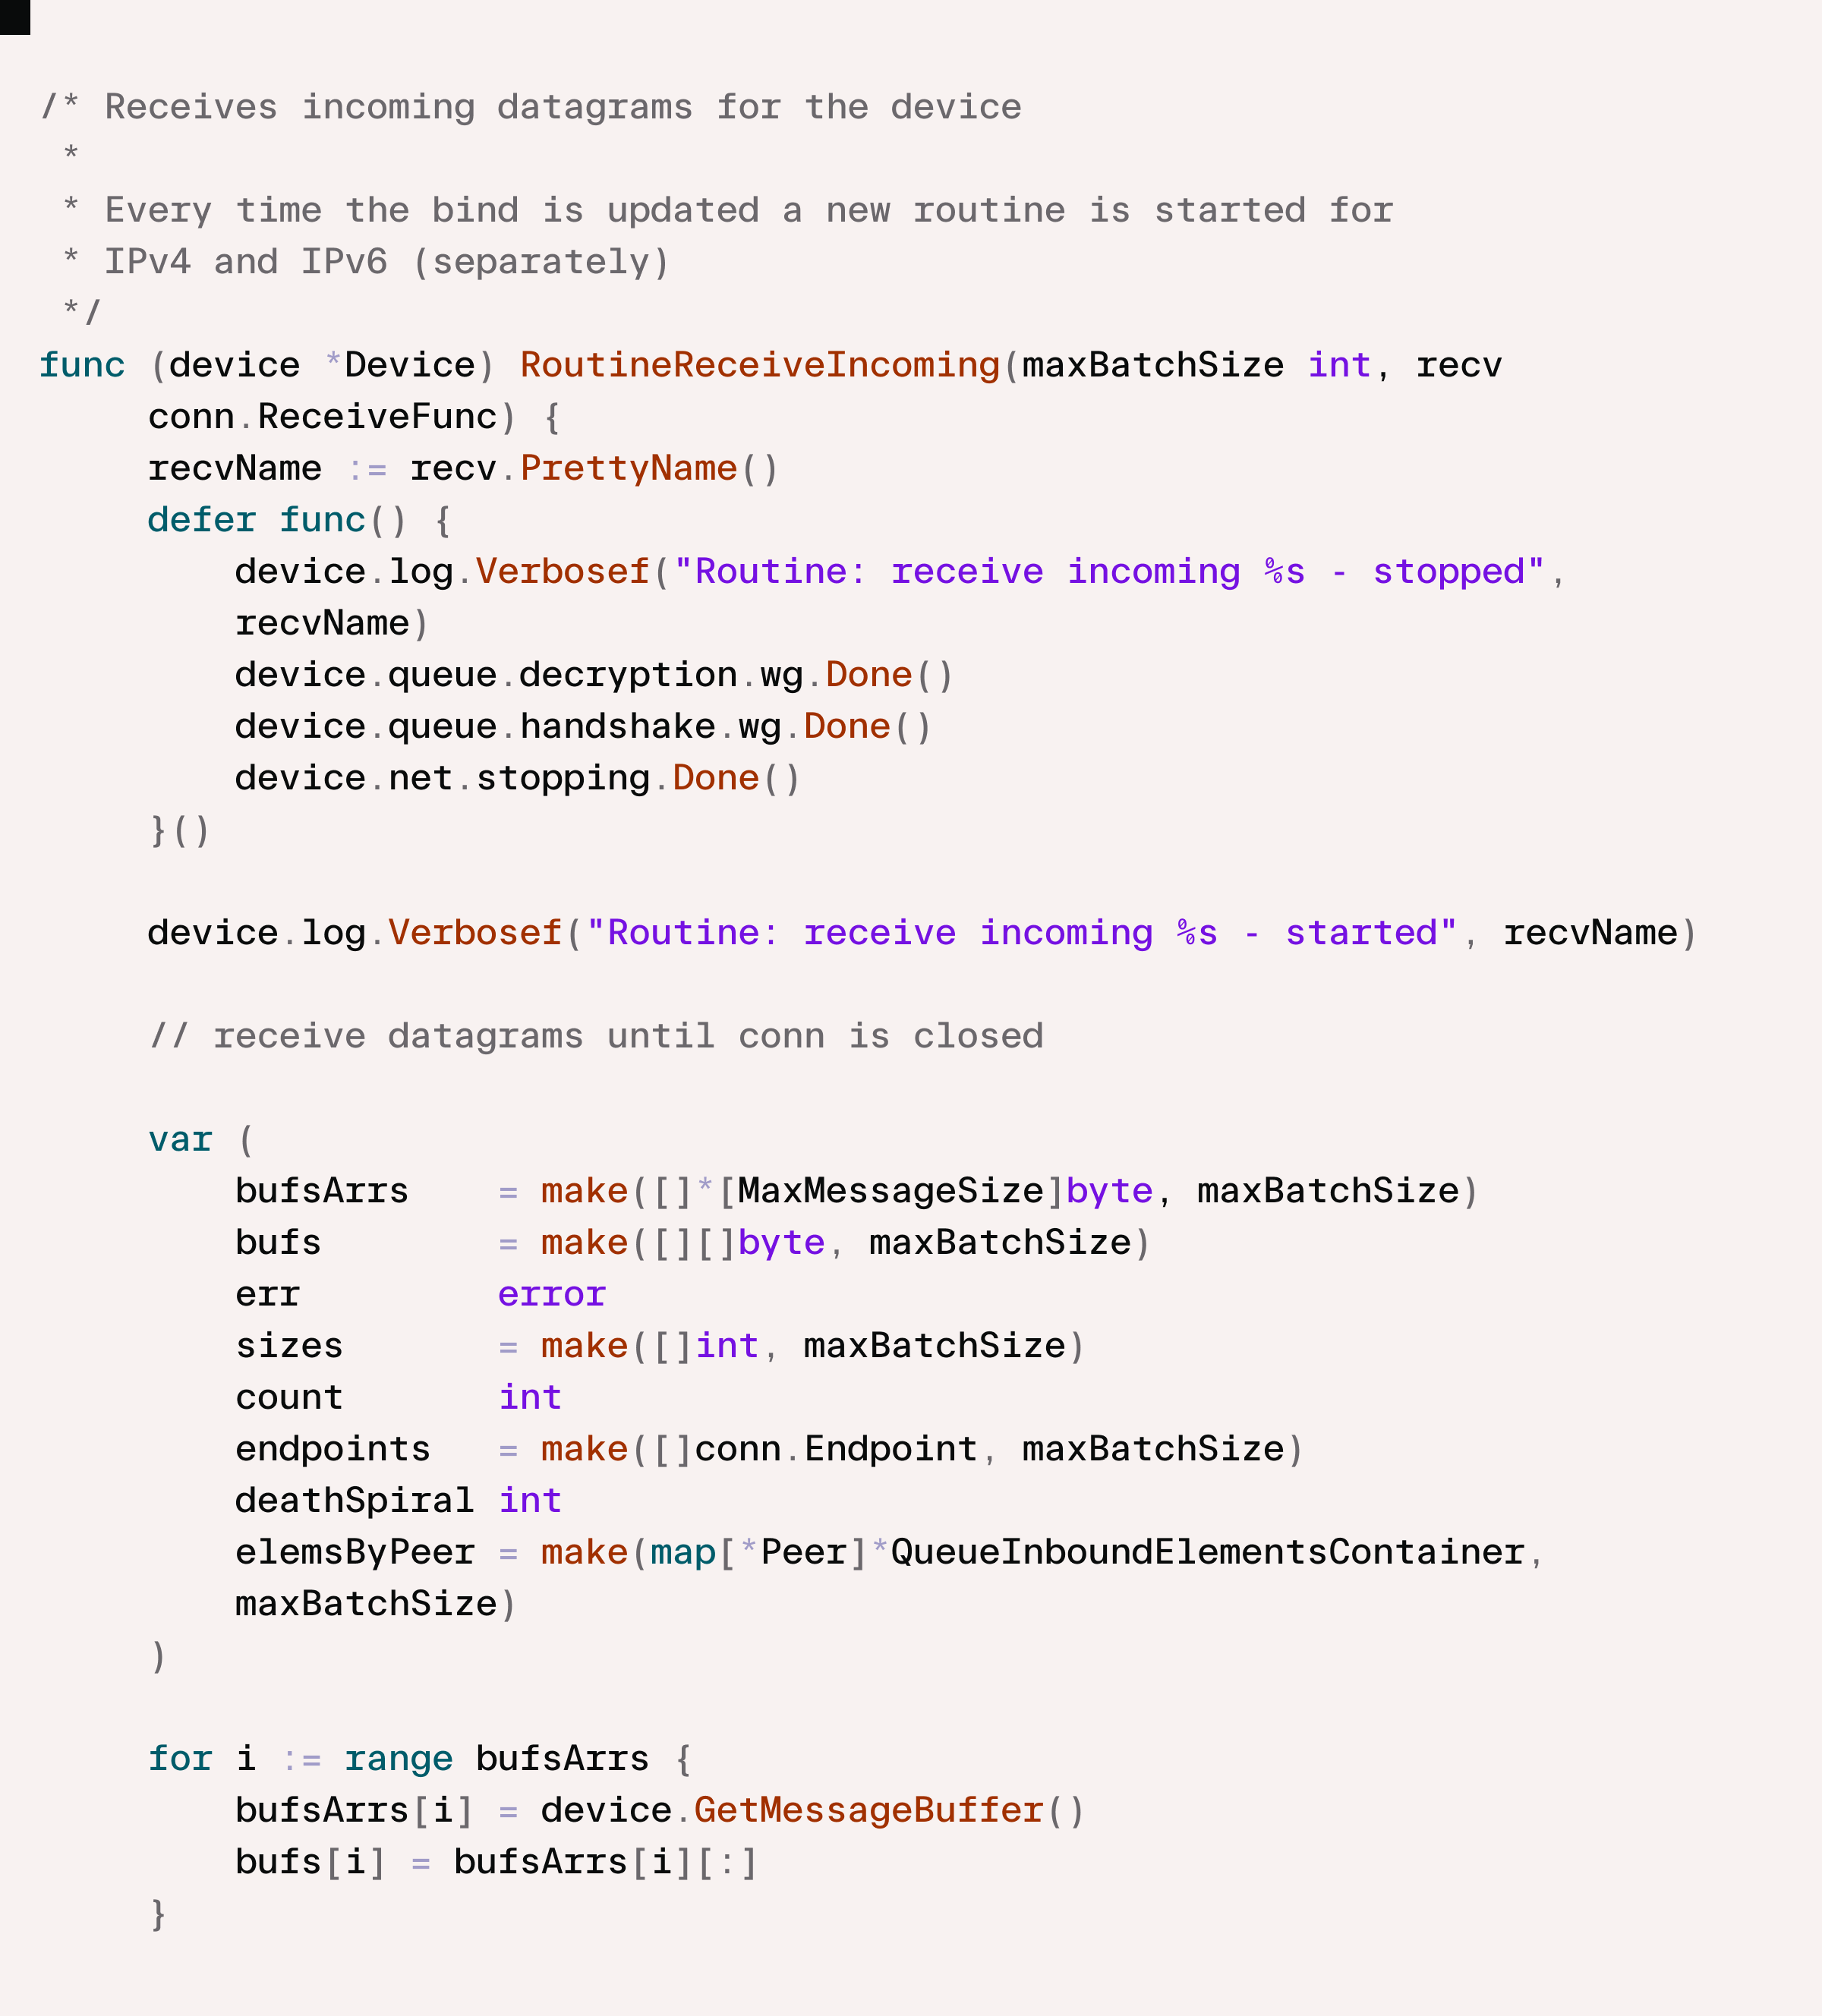
and
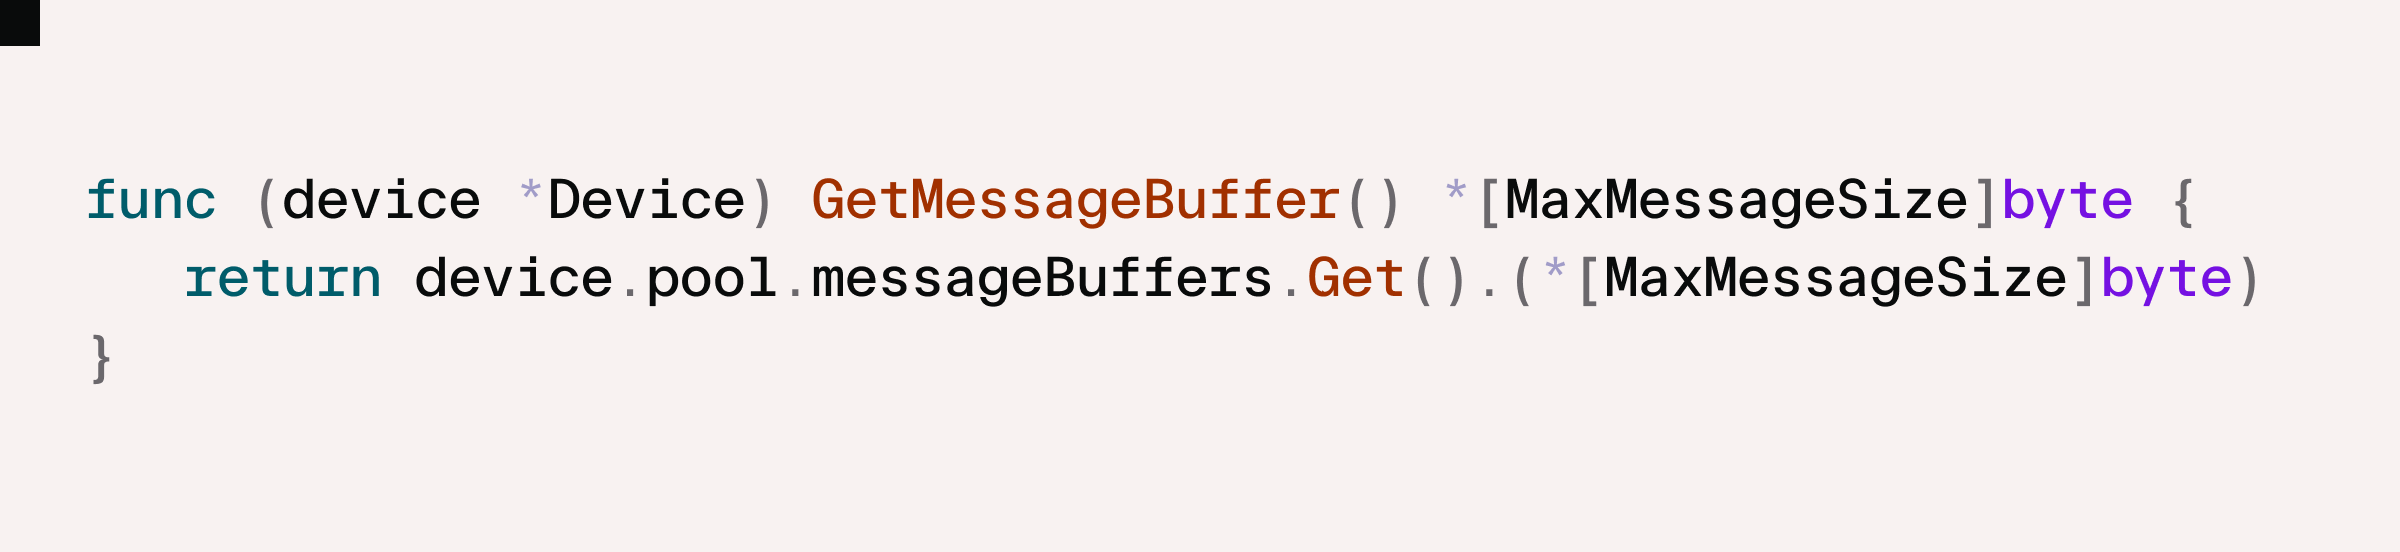
Wireguard allocates maxBatchSize buffers of size MaxMessageSize ( = 64kB on Linux, the maximum size of a UDP payload). When paired with Tailscale like in Coder, the maxBatchSize is set by the Wireguard constant IdealBatchSize ( = 128). So we have buffer allocations of 128 * 64 kB = 8 MB, or 16 MB on a dual IPv4 / IPv6 system. This is small in the context of per-process memory usage in production, but as we have seen adds up to GB in our tests.
Lowering the peak
From here we considered several options.
The reason that Coder Server (and the Workspace Proxy) have a Wireguard device is so that they can proxy HTTP requests to the Workspace when requested by an authorized user. A minority of test cases actually do this, so we could simply disable creating a Wireguard device in tests that don’t need it. But, figuring out which tests need the Wireguard device and which don’t would be an expensive undertaking in our multi-thousand-case suite of tests. Furthermore, it would still leave the memory allocations in the tests that did proxy HTTP requests.
When communication with workspaces is needed, at a high level, the Go code just expects to get a net.Conn instance: the actual Wireguard device underpinning it is very deep and abstracted away. This suggested a second option: mocking out the Workspace networking subsystem (which we call tailnet because it embeds the open source Tailscale software). A lightweight, per-test mock could serve connections using the in-memory net.Pipe() call. This would drop the memory allocation to essentially nil, but at the cost of a significant refactor, and would reduce the test coverage of the actual networking subsystem.
The option we went with in the end involved a deep dive into Wireguard internals.
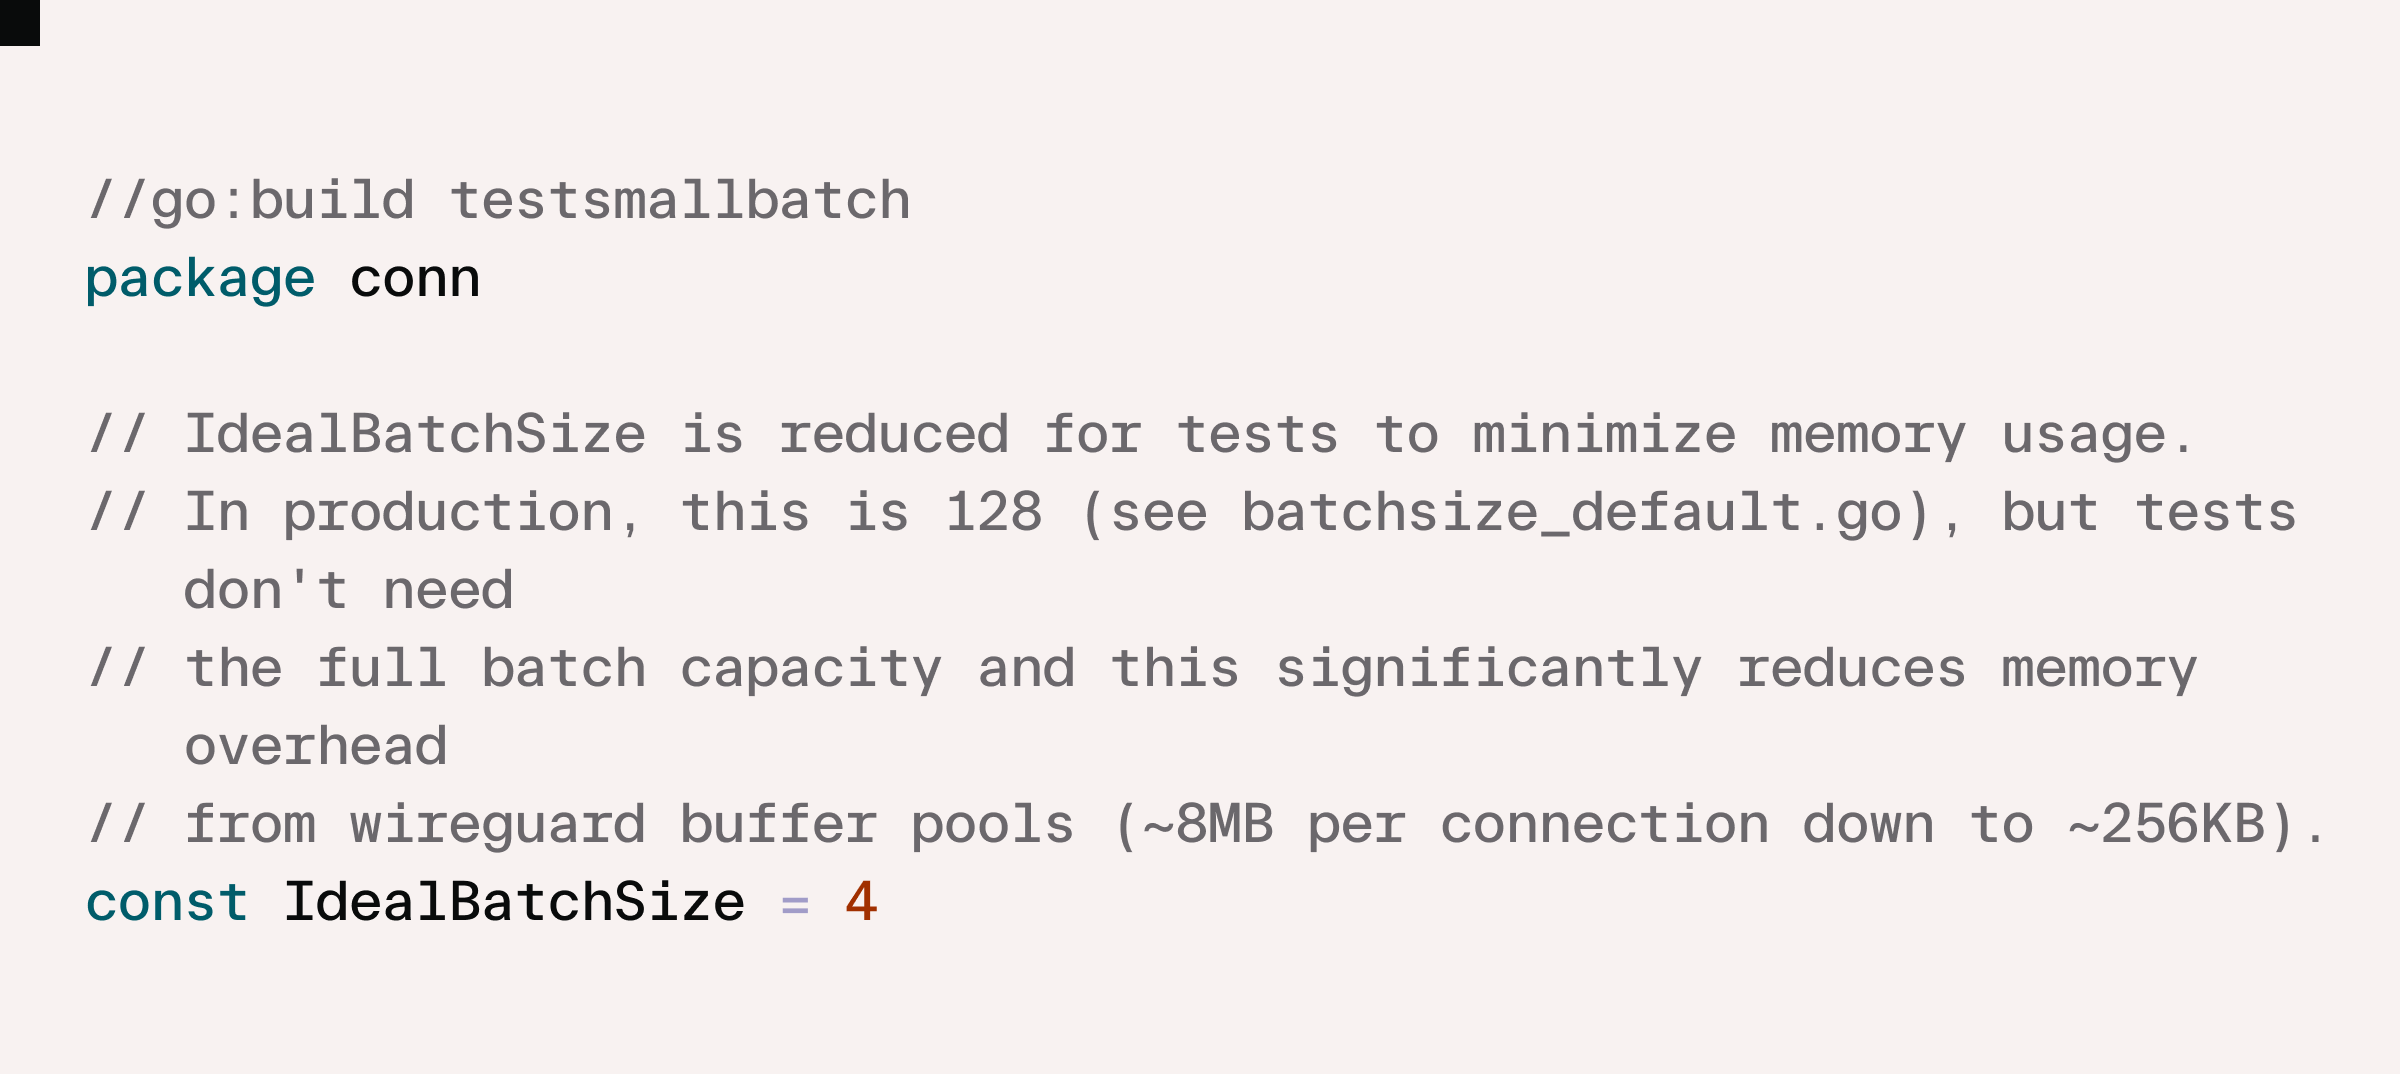
It’s straightforward to verify that IdealBatchSize is a purely performance optimization constant. We can change its value and get the same functional behavior for our Wireguard device. The choice of 128 for production systems balances latency and memory usage against the overhead of making more calls to the OS kernel. In our testing scenarios we send very little data over Wireguard. Most tests send nothing, and those that do often exchange a single HTTP request/response.
Our fix is just a couple lines of code, taking advantage of Go build flags to ensure we only make the change in tests.
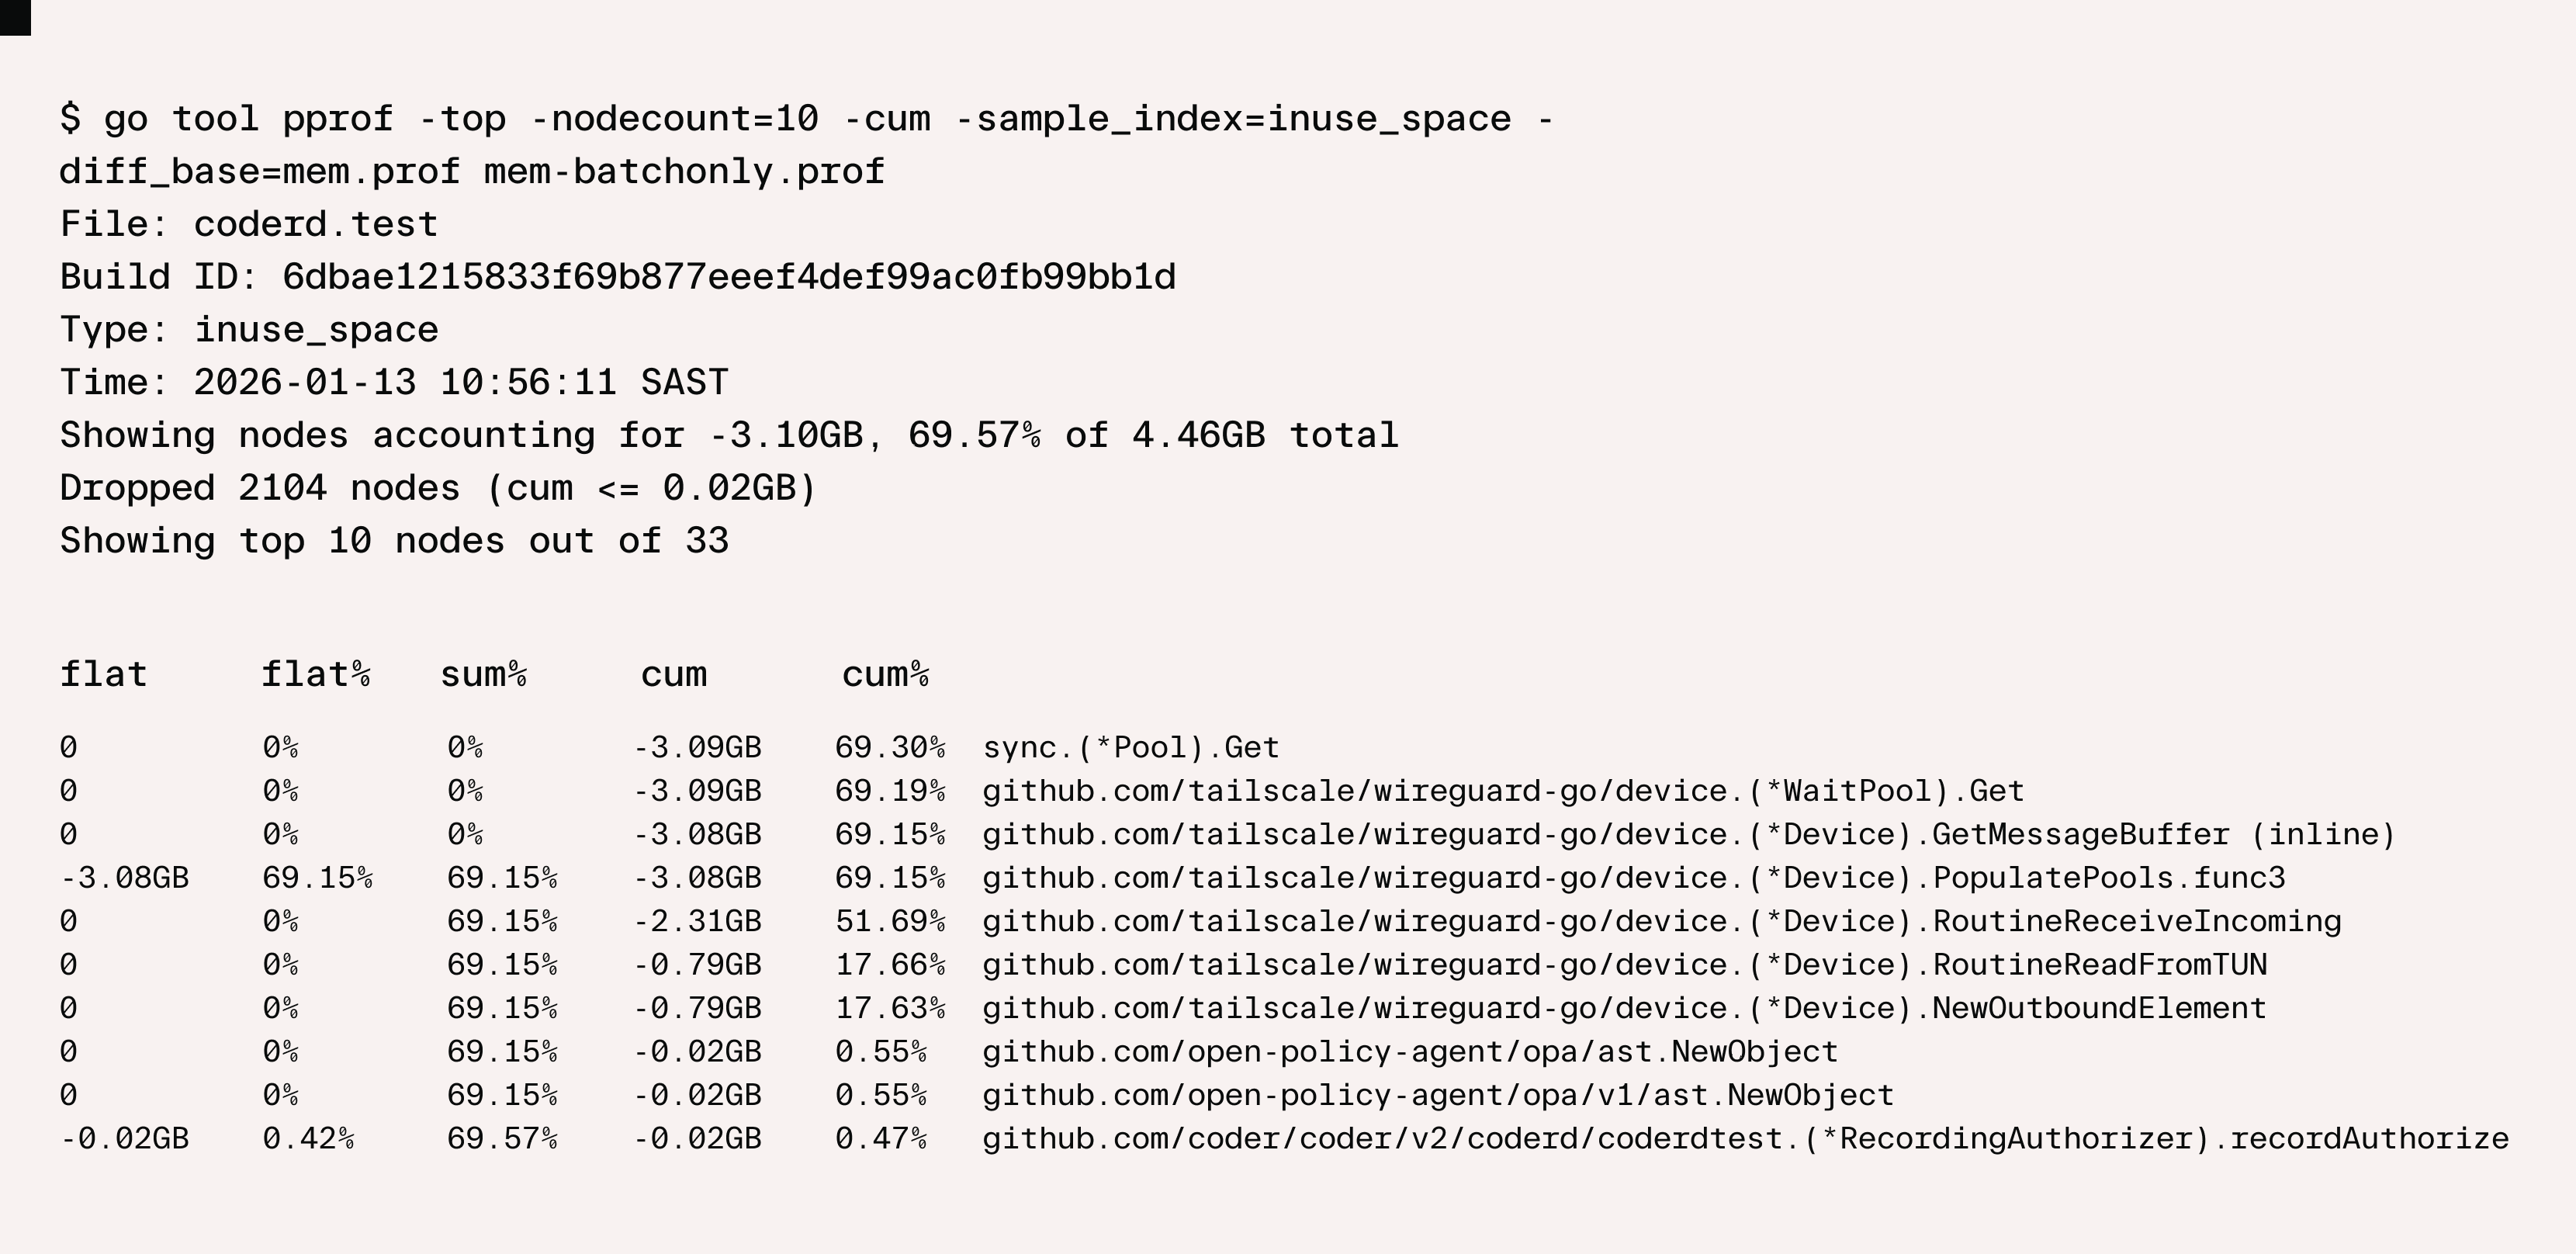
We could go even further by also reducing the MaxMessageSize but it’s a little less straightforward to verify this doesn’t change functional behavior. Buffers smaller than the received UDP packets cause truncation and for Wireguard, truncated means discarded. While the buffers were the single largest contributor, they “only” represented 71% of the memory. Amdahl’s Law applies here: our 32x reduction in buffer memory (in percentage terms, a 97% reduction) translates to just shy of 69% reduction overall. A further reduction by 32x (that is 1024x overall) only ekes out another 3% reduction (71% overall).
We can use go tool pprof to examine the savings, using the -diff_base flag to compare with previous:
Key Takeaways
Two lines of code. A 69% reduction in peak test memory. The fix itself was straightforward — but only because we resisted the urge to act on our first instinct and instead let the data lead us there.
Postgres seemed like the obvious culprit. It wasn't. The real cause was buried deep in Wireguard's allocation behavior, accumulating silently across thousands of test cases over years of growth. Profiling early with -memprofile and go tool pprof made the answer clear in minutes. From there, Go build flags gave us a clean, safe way to apply the fix without touching production behavior at all.
The test suite is faster. The machines breathe easier. And the next time something quietly compounds in the background, we know the playbook.

Subscribe to our newsletter
Want to stay up to date on all things Coder? Subscribe to our monthly newsletter for the latest articles, workshops, events, and announcements.