The workspace process logging feature allows you to log all system-level processes executing in the workspace.
Enabling workspace process logging adds a sidecar to your workspaces that will log all processes users start in the workspace (e.g., commands executed in the terminal or system processes created by background services in CVM workspaces). You can view the output from the sidecar or send it to a monitoring stack, such as CloudWatch, for further analysis.
Please note that these logs are not recorded or captured by the Coder organization in any way, shape, or form.
How this works
Coder uses eBPF (which we chose for its speed) to perform in-kernel
logging and filtering of all exec system calls to match events originating
from the workspace.
The core of this feature is also open source and can be found in the
exectrace repo on GitHub repo.
Requirements
Use of the workspace process logging functionality requires a host Linux
kernel >= 5.8 with the kernel config CONFIG_DEBUG_INFO_BTF=y enabled.
To validate this config is enabled, run either of the following commands on the nodes directly (not from the terminal within a workspace):
cat /proc/config.gz | gunzip | grep CONFIG_DEBUG_INFO_BTF
cat "/boot/config-$(uname -r)" | grep CONFIG_DEBUG_INFO_BTF
Enable workspace process logging
To enable workspace process logging:
- Log into Coder as a site manager.
- Go to Manage > Admin.
- On the Infrastructure page, scroll down to the Workspace container runtime section.
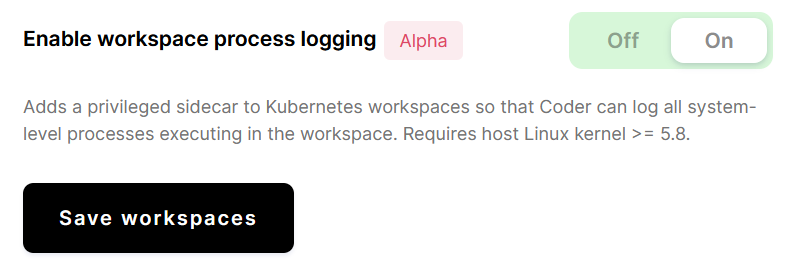
- Toggle on Enable workspace command execution recording.
- Click Save workspaces.
This setting will apply to all new workspaces; it will apply to existing workspaces only after they have been rebuilt.
View logs
To view the process logs from a specific user or workspace, you can use your
cloud provider's log viewer, or you can use kubectl to print the logs:
kubectl logs \
  --selector="com.coder.username=jessie" \        # Filter by the user "jessie"
  --selector="com.coder.workspace.name=main" \    # Filter by the workspace "main"
  --container exectrace                           # Only show logs from the sidecar
The raw logs will look something like this:
{
  "ts": "2022-02-28T20:29:38.038452202Z",
  "level": "INFO",
  "msg": "exec",
  "caller": "/go/src/coder.com/m/product/coder/cmd/envbox/exectrace.go:176",
  "func": "main.runExectrace",
  "fields": {
    "labels": {
      "organization_id": "default",
      "user_email": "[email protected]",
      "user_id": "5e876e9a-121663f01ebd1522060d5270",
      "username": "jessie",
      "workspace_id": "621d2e52-a6987ef6c56210058ee2593c",
      "workspace_name": "main"
    },
    "cmdline": "uname -a",
    "event": {
      "filename": "/usr/bin/uname",
      "argv": ["uname", "-a"],
      "truncated": false,
      "pid": 920684,
      "uid": 101000,
      "gid": 101000,
      "comm": "bash"
    }
  }
}
View logs in AWS EKS
If you're using AWS' Elastic Kubernetes Service, you can configure your cluster to send logs to CloudWatch. This allows you to view the logs for a specific user or workspace.
To view your logs, go to the CloudWatch dashboard (which is available on the Log Insights tab) and run a query similar to the following:
fields @timestamp, log_processed.fields.cmdline
| sort @timestamp asc
| filter kubernetes.container_name="exectrace"
| filter log_processed.fields.labels.username="zac"
| filter log_processed.fields.labels.workspace_name="code"
Usage considerations
- This feature is only supported on Kubernetes workspaces. None of the other workspace types (such as those on EC2 or using Coder for Docker) currently include process logging capabilities.
- With this feature enabled, all of the nodes on which Coder schedules
workspaces run Linux kernel >= 5.8. If not, workspaces scheduled on
incompatible nodes will fail to start correctly for security reasons.
- Google Kubernetes Engine users: At this time, GKE's stable branch runs Linux kernel 5.4; as such, this feature doesn't work on GKE (you may be able to leverage this feature if you opt for the rapid branch instead).
- AWS Elastic Kubernetes Service users: EKS kernels on the Ubuntu 20.04 image family use the kernel version necessary for this feature (we have not tested other image families)
- The sidecar attached to each workspace is a privileged container (this is similar to the CVM container on CVM-enabled workspaces), so you may need to review your organization's security policies before enabling this feature. Enabling workspace process logging does not grant extra privileges to the workspace container itself, however.
- Coder logs processes from nested Docker containers (including deeply nested containers) correctly, but Coder does not distinguish between processes started in the workspace and processes started in a child container in the logs.
- With CVM-enabled workspaces, this feature may detect and log startup processes begun in the outer container (including container initialization processes).
- Because this feature logs all processes in the workspace, high levels of
usage (e.g., during a
makerun) will result in an abundance of output in the sidecar container. Depending on how your Kubernetes cluster is configured, you may incur extra charges from your cloud provider to store the additional logs.