Speed up your workspaces
October 31, 2024
If it takes your workspace a long time to start, find out why and make some changes to your Coder templates to help speed things up.
Monitoring
You can monitor Coder logs through the system-native tools on your deployment platform, or stream logs to tools like Splunk, Datadog, Grafana Loki, and others.
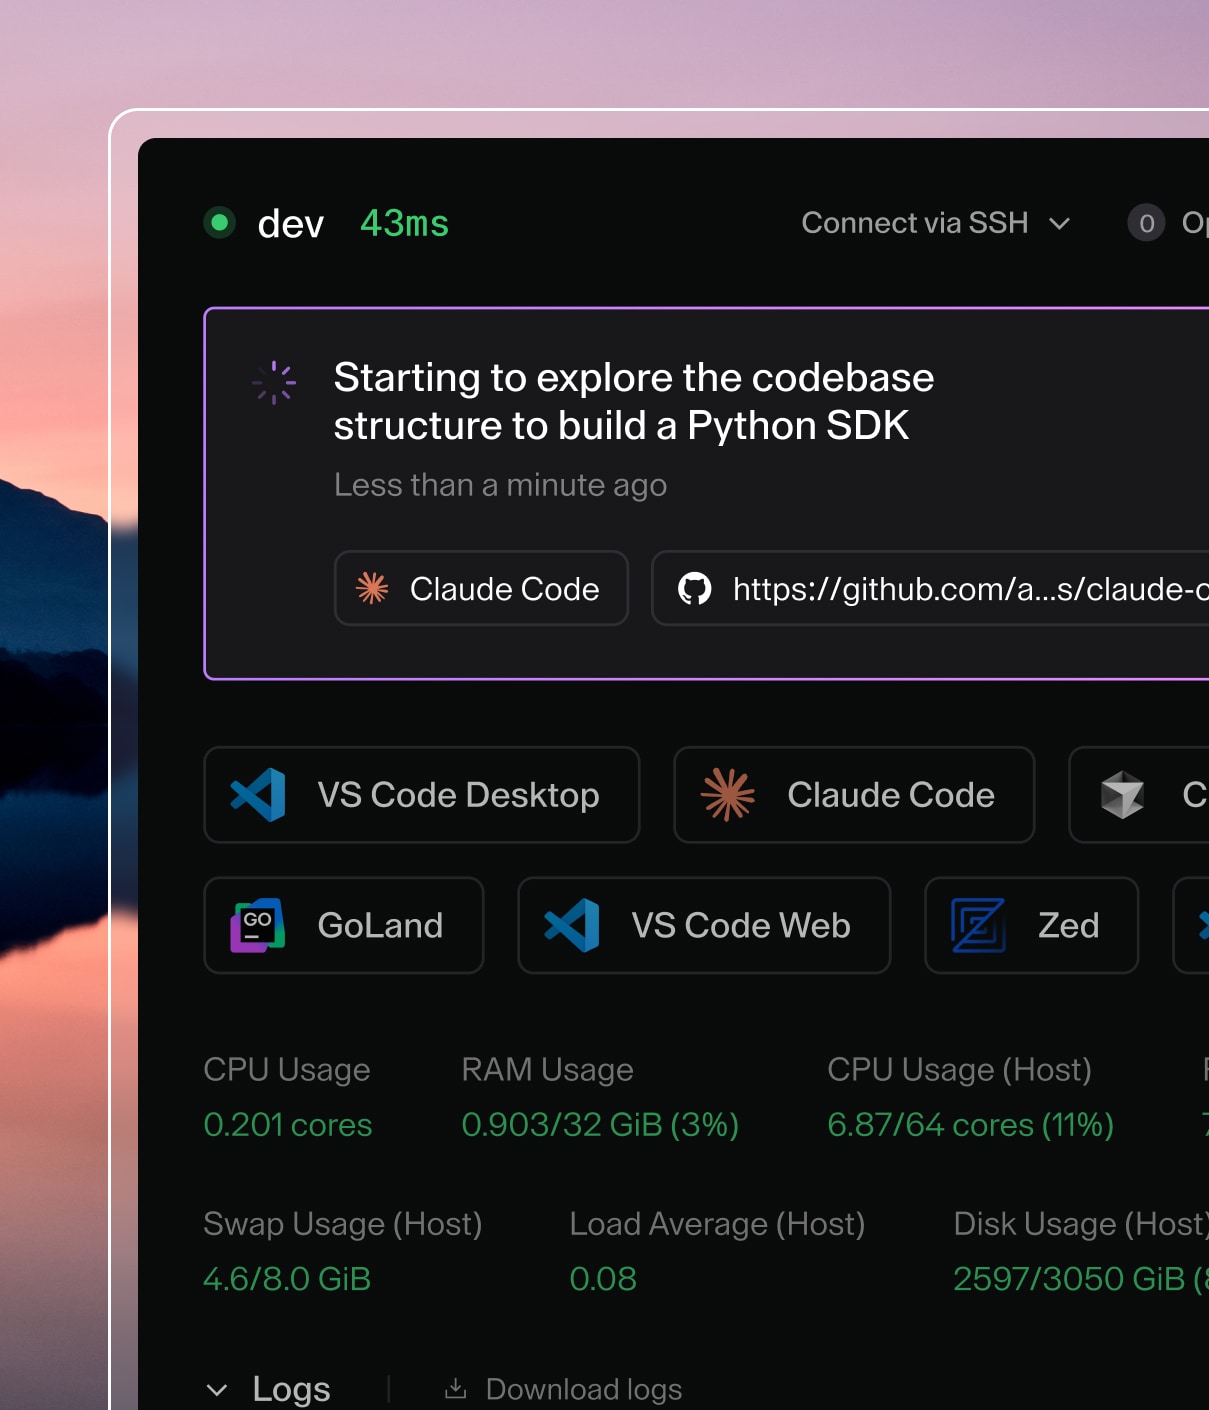
Workspace build timeline
Use the Build timeline to monitor the time it takes to start specific workspaces. Identify long scripts, resources, and other things you can potentially optimize within the template.

Adjust this request to match your Coder access URL and workspace:
curl -X GET https://coder.example.com/api/v2/workspacebuilds/{workspacebuild}/timings \
  -H 'Accept: application/json' \
  -H 'Coder-Session-Token: API_KEY'
Visit the API documentation for more information.
Coder Observability Chart
Use the Observability Helm chart for a pre-built set of dashboards to monitor your control plane over time. It includes Grafana, Prometheus, Loki, and Alert Manager out-of-the-box, and can be deployed on your existing Grafana instance.
We recommend that all administrators deploying on Kubernetes or on an existing Prometheus or Grafana stack set the observability bundle up with the control plane from the start. For installation instructions, visit the observability repository, or our Kubernetes installation guide.
Enable Prometheus metrics for Coder
Prometheus.io
is included as part of the observability chart. It
offers a variety of
available metrics,
such as coderd_provisionerd_job_timings_seconds and
coderd_agentstats_startup_script_seconds, which measure how long the workspace
takes to provision and how long the startup script takes.
You can install it separately if you prefer.
Provisioners
coder server defaults to three provisioner daemons. Each provisioner daemon
can handle one single job, such as start, stop, or delete at a time and can be
resource intensive. When all provisioners are busy, workspaces enter a "pending"
state until a provisioner becomes available.
Increase provisioner daemons
Provisioners are queue-based to reduce unpredictable load to the Coder server. However, they can be scaled up to allow more concurrent provisioners. You risk overloading the central Coder server if you use too many built-in provisioners, so we recommend a maximum of five provisioners. For more than five provisioners, we recommend that you move to external provisioners.
If you can’t move to external provisioners, use the provisioner-daemons flag
to increase the number of provisioner daemons to five:
coder server --provisioner-daemons=5
Visit the CLI documentation for more information about increasing provisioner daemons, configuring external provisioners, and other options.
Adjust provisioner CPU/memory
We recommend that you deploy Coder to its own respective Kubernetes cluster, separate from production applications. Keep in mind that Coder runs development workloads, so the cluster should be deployed as such, without production-level configurations.
Adjust the CPU and memory values as shown in Helm provisioner values.yaml:
…
  resources:
    limits:
      cpu: "0.25"
      memory: "1Gi"
    requests:
      cpu: "0.25"
      memory: "1Gi"
…
Visit the validated architecture documentation for more information.
Set up Terraform provider caching
By default, Coder downloads each Terraform provider when a workspace starts. This can create unnecessary network and disk I/O.
terraform init generates a .terraform.lock.hcl which instructs Coder
provisioners to cache specific versions of your providers.
To use terraform init to cache providers:
-
Pull the templates to your local device:
coder templates pull -
Run
terraform initto initialize the directory:terraform init -
Push the templates back to your Coder deployment:
coder templates push