


Agent Metadata
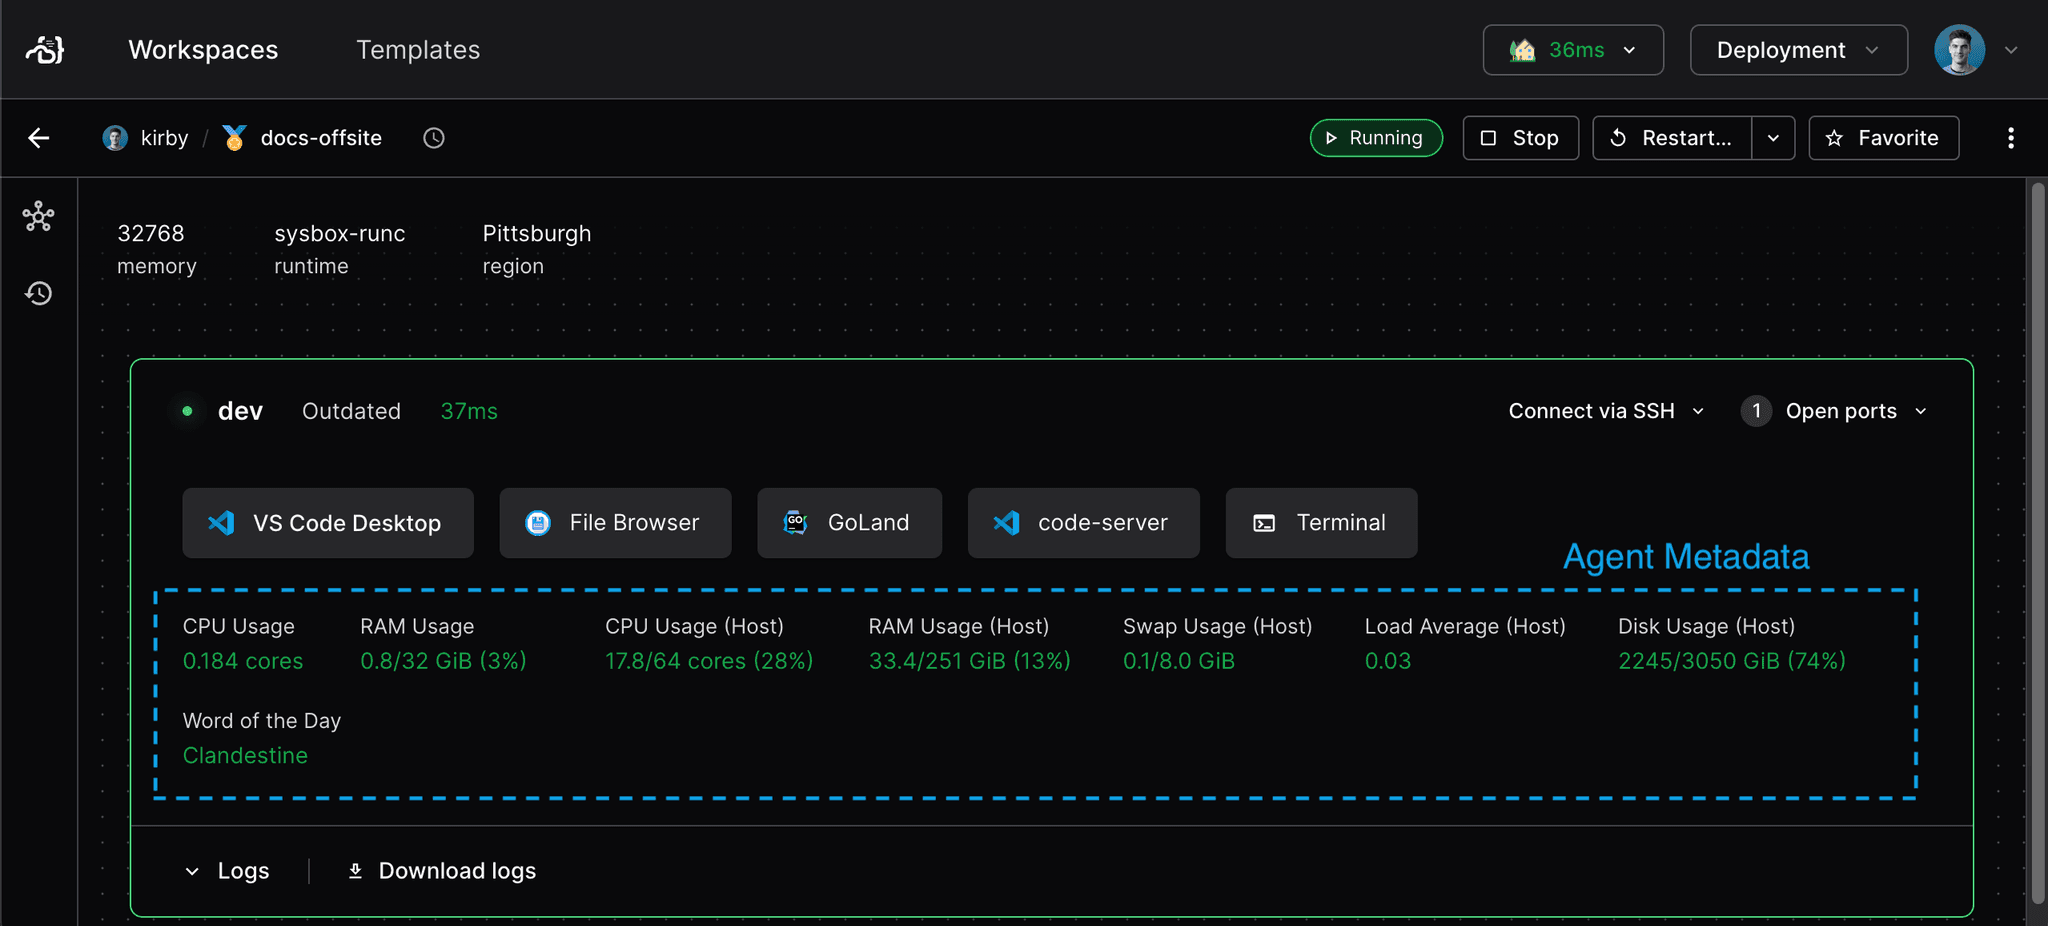
You can show live operational metrics to workspace users with agent metadata. It is the dynamic complement of resource metadata.
You specify agent metadata in the
coder_agent.
Examples
All of these examples use heredoc strings for the script declaration. With heredoc strings, you can script without messy escape codes, just as if you were working in your terminal.
Some of the examples use the coder stat
command. This is useful for determining CPU and memory usage of the VM or
container that the workspace is running in, which is more accurate than resource
usage about the workspace's host.
Here's a standard set of metadata snippets for Linux agents:
resource "coder_agent" "main" {
  os             = "linux"
  ...
  metadata {
    display_name = "CPU Usage"
    key  = "cpu"
    # Uses the coder stat command to get container CPU usage.
    script = "coder stat cpu"
    interval = 1
    timeout = 1
  }

  metadata {
    display_name = "Memory Usage"
    key  = "mem"
    # Uses the coder stat command to get container memory usage in GiB.
    script = "coder stat mem --prefix Gi"
    interval = 1
    timeout = 1
  }

  metadata {
    display_name = "CPU Usage (Host)"
    key  = "cpu_host"
    # calculates CPU usage by summing the "us", "sy" and "id" columns of
    # top.
    script = <<EOT
    top -bn1 | awk 'FNR==3 {printf "%2.0f%%", $2+$3+$4}'
    EOT
    interval = 1
    timeout = 1
  }

    metadata {
    display_name = "Memory Usage (Host)"
    key  = "mem_host"
    script = <<EOT
    free | awk '/^Mem/ { printf("%.0f%%", $4/$2 * 100.0) }'
    EOT
    interval = 1
    timeout = 1
  }

  metadata {
    display_name = "Disk Usage"
    key  = "disk"
    script = "df -h | awk '$6 ~ /^\\/$/ { print $5 }'"
    interval = 1
    timeout = 1
  }

  metadata {
    display_name = "Load Average"
    key  = "load"
    script = <<EOT
        awk '{print $1,$2,$3}' /proc/loadavg
    EOT
    interval = 1
    timeout = 1
  }
}
Useful utilities
You can also show agent metadata for information about the workspace's host.
top is
available in most Linux distributions and provides virtual memory, CPU and IO
statistics. Running top produces output that looks like:
%Cpu(s): 65.8 us,  4.4 sy,  0.0 ni, 29.3 id,  0.3 wa,  0.0 hi,  0.2 si,  0.0 st
MiB Mem :  16009.0 total,    493.7 free,   4624.8 used,  10890.5 buff/cache
MiB Swap:      0.0 total,      0.0 free,      0.0 used.  11021.3 avail Mem
vmstat is
available in most Linux distributions and provides virtual memory, CPU and IO
statistics. Running vmstat produces output that looks like:
procs -----------memory---------- ---swap-- -----io---- -system-- ------cpu-----
r  b   swpd   free   buff  cache   si   so    bi    bo   in   cs us sy id wa st
0  0  19580 4781680 12133692 217646944    0    2     4    32    1    0  1  1 98  0  0
dstat is
considerably more parseable than vmstat but often not included in base images.
It is easily installed by most package managers under the name dstat. The
output of running dstat 1 1 looks like:
--total-cpu-usage-- -dsk/total- -net/total- ---paging-- ---system--
usr sys idl wai stl| read  writ| recv  send|  in   out | int   csw
1   1  98   0   0|3422k   25M|   0     0 | 153k  904k| 123k  174k
Managing the database load
Agent metadata can generate a significant write load and overwhelm your Coder database if you're not careful. The approximate writes per second can be calculated using the formula:
(metadata_count * num_running_agents * 2) / metadata_avg_interval
For example, let's say you have
- 10 running agents
- each with 6 metadata snippets
- with an average interval of 4 seconds
You can expect (10 * 6 * 2) / 4, or 30 writes per second.
One of the writes is to the UNLOGGED workspace_agent_metadata table and the
other to the NOTIFY query that enables live stats streaming in the UI.