

Monitoring
Learn about our the tools, techniques, and best practices to monitor your Coder deployment.
Quick Start: Observability Helm Chart
Deploy Prometheus, Grafana, Alert Manager, and pre-built dashboards on your Kubernetes cluster to monitor the Coder control plane, provisioners, and workspaces.
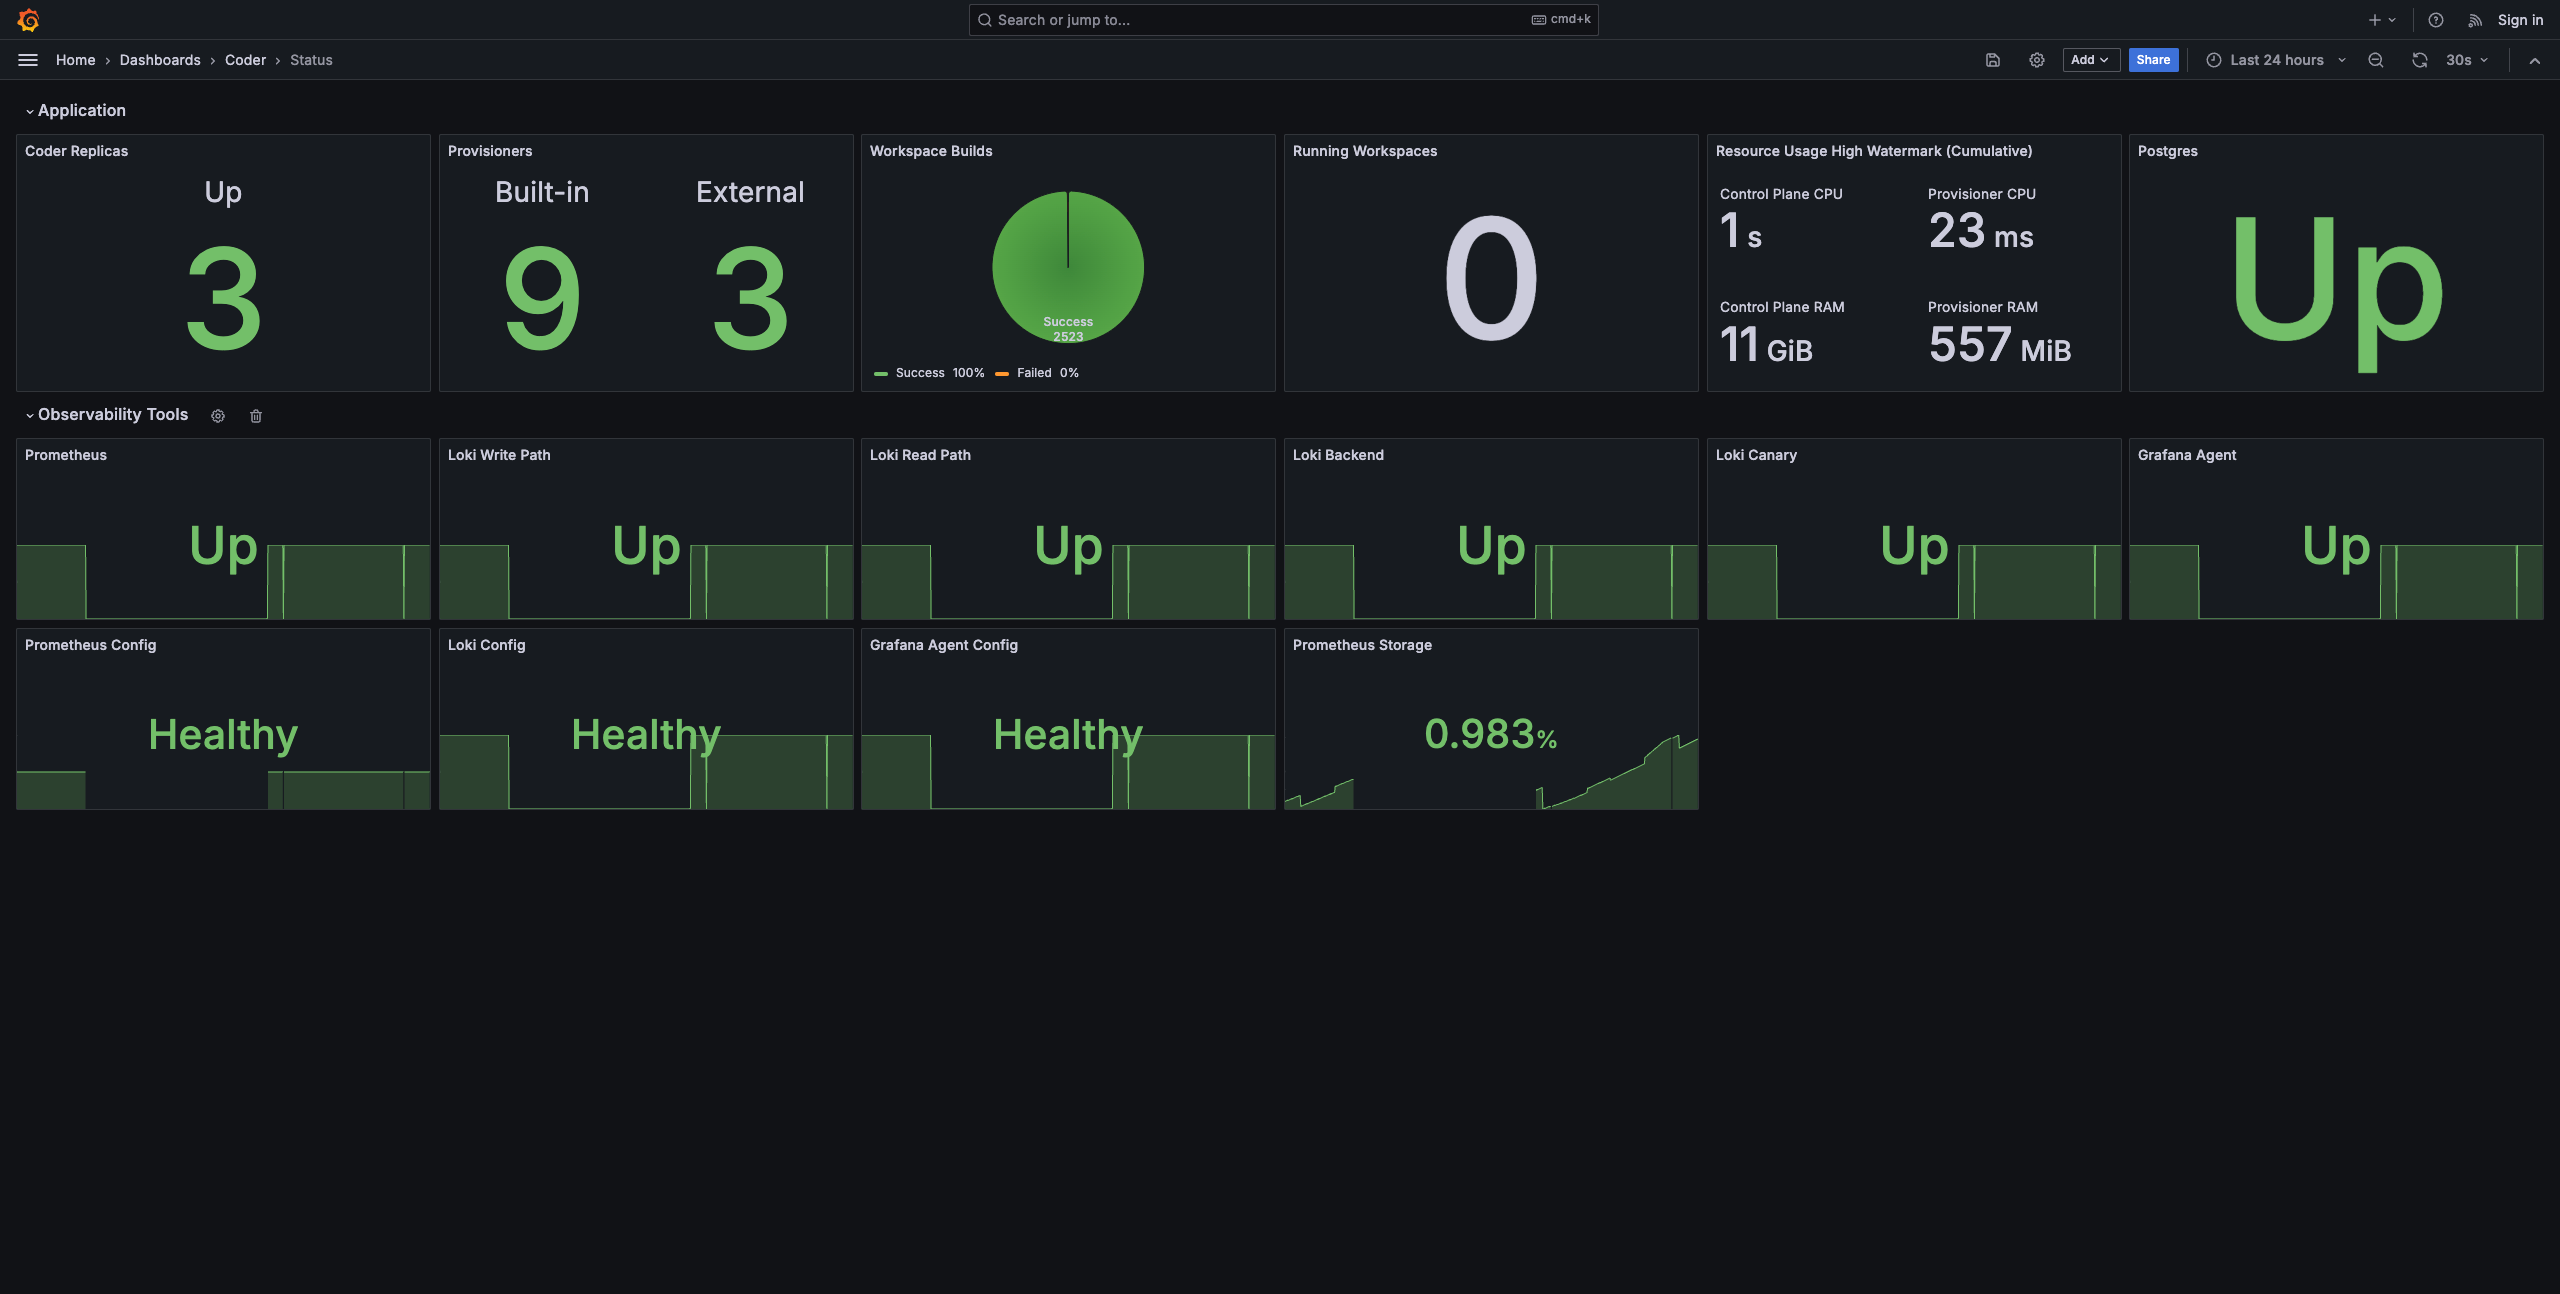
Learn how to install & read the docs on the Observability Helm Chart GitHub
Table of Contents
- Logs: Learn how to access to Coder server logs, agent logs, and even how to expose Kubernetes pod scheduling logs.
- Metrics: Learn about the valuable metrics to measure on a Coder deployment, regardless of your monitoring stack.
- Health Check: Learn about the periodic health check and error codes that run on Coder deployments.
- Connection Logs: Monitor connections to workspaces.