

Connection Logs
Note
Connection logs require a Premium license. For more details, contact your account team.
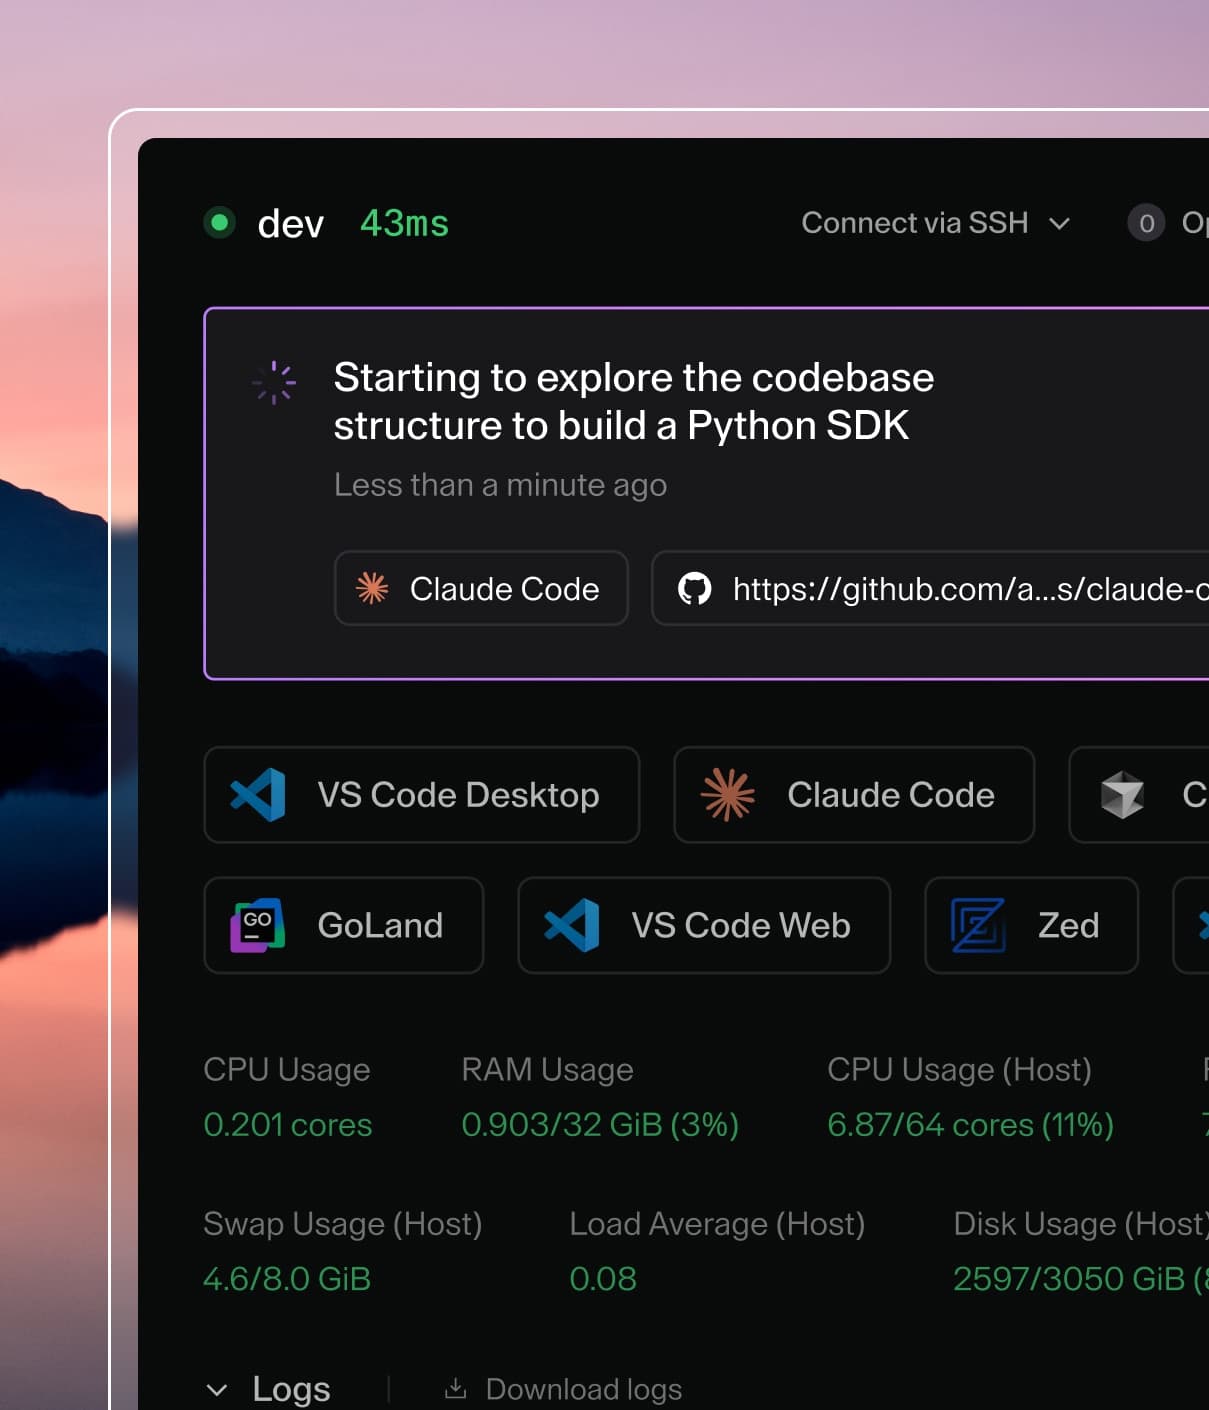
The Connection Log page in the dashboard allows Auditors to monitor workspace agent connections.
Workspace App Connections
The connection log contains a complete record of all workspace app connections. These originate from within the Coder deployment, and thus the connection log is a source of truth for these events.
Browser Port Forwarding
The connection log contains a complete record of all workspace port forwarding performed via the dashboard.
SSH and IDE Sessions
The connection log aims to capture a record of all workspace SSH and IDE sessions. These events are reported by workspace agents, and their receipt by the server is not guaranteed.
How to Filter Connection Logs
You can filter connection logs by the following parameters:
organization- The name or ID of the organization of the workspace being connected to.workspace_owner- The username of the owner of the workspace being connected to.type- The type of the connection, such as SSH, VS Code, or workspace app. For more connection types, refer to the CoderSDK documentation.username: The name of the user who initiated the connection. Results will not include SSH or IDE sessions.user_email: The email of the user who initiated the connection. Results will not include SSH or IDE sessions.connected_after: The time after which the connection started. Uses the RFC3339Nano format.connected_before: The time before which the connection started. Uses the RFC3339Nano format.workspace_id: The ID of the workspace being connected to.connection_id: The ID of the connection.status: The status of the connection, eitherongoingorcompleted. Some events are neither ongoing nor completed, such as the opening of a workspace app.
Capturing/Exporting Connection Logs
In addition to the Coder dashboard, there are multiple ways to consume or query connection events.
REST API
You can retrieve connection logs via the Coder API.
Visit the
get-connection-logs endpoint documentation
for details.
Service Logs
Connection events are also dispatched as service logs and can be captured and categorized using any log management tool such as Splunk.
Example of a JSON formatted connection log entry, when an SSH connection is made:
{
    "ts": "2025-07-03T05:09:41.929840747Z",
    "level": "INFO",
    "msg": "connection_log",
    "caller": "/home/coder/coder/enterprise/audit/backends/slog.go:38",
    "func": "github.com/coder/coder/v2/enterprise/audit/backends.(*SlogExporter).ExportStruct",
    "logger_names": ["coderd"],
    "fields": {
        "request_id": "916ad077-e120-4861-8640-f449d56d2bae",
        "ID": "ca5dfc63-dc43-463a-bb3e-38526866fd4b",
        "OrganizationID": "1a2bb67e-0117-4168-92e0-58138989a7f5",
        "WorkspaceOwnerID": "fe8f4bab-3128-41f1-8fec-1cc0755affe5",
        "WorkspaceID": "05567e23-31e2-4c00-bd05-4d499d437347",
        "WorkspaceName": "dev",
        "AgentName": "main",
        "Type": "ssh",
        "Code": null,
        "Ip": "fd7a:115c:a1e0:4b86:9046:80e:6c70:33b7",
        "UserAgent": "",
        "UserID": null,
        "SlugOrPort": "",
        "ConnectionID": "7a6fafdc-e3d0-43cb-a1b7-1f19802d7908",
        "DisconnectReason": "",
        "Time": "2025-07-10T10:14:38.942776145Z",
        "ConnectionStatus": "connected"
    }
}
Example of a human readable
connection log entry, when code-server is opened:
[API] 2025-07-03 06:57:16.157 [info] coderd: connection_log request_id=de3f6004-6cc1-4880-a296-d7c6ca1abf75 ID=f0249951-d454-48f6-9504-e73340fa07b7 Time="2025-07-03T06:57:16.144719Z" OrganizationID=0665a54f-0b77-4a58-94aa-59646fa38a74 WorkspaceOwnerID=6dea5f8c-ecec-4cf0-a5bd-bc2c63af2efa WorkspaceID=3c0b37c8-e58c-4980-b9a1-2732410480a5 WorkspaceName=dev AgentName=main Type=workspace_app Code=200 Ip=127.0.0.1 UserAgent="Mozilla/5.0 (X11; Linux x86_64) AppleWebKit/537.36 (KHTML, like Gecko) Chrome/100.0.4896.127 Safari/537.36" UserID=6dea5f8c-ecec-4cf0-a5bd-bc2c63af2efa SlugOrPort=code-server ConnectionID=<nil> DisconnectReason="" ConnectionStatus=connected
Data Retention
Coder supports configurable retention policies that automatically purge old
Connection Logs. To enable automated purging, configure the
--connection-logs-retention flag or CODER_CONNECTION_LOGS_RETENTION
environment variable. For comprehensive configuration options, see
Data Retention.
How to Enable Connection Logs
This feature is only available with a Premium license.