Coder powers secure, scalable development across key industries — automotive, finance, government, and technology — enabling faster builds, tighter compliance, and seamless AI adoption in enterprise-grade cloud environments.
AI Gateway requires the AI Governance Add-On.
As of Coder v2.32, deployments without the add-on will not be able to
access AI Gateway.
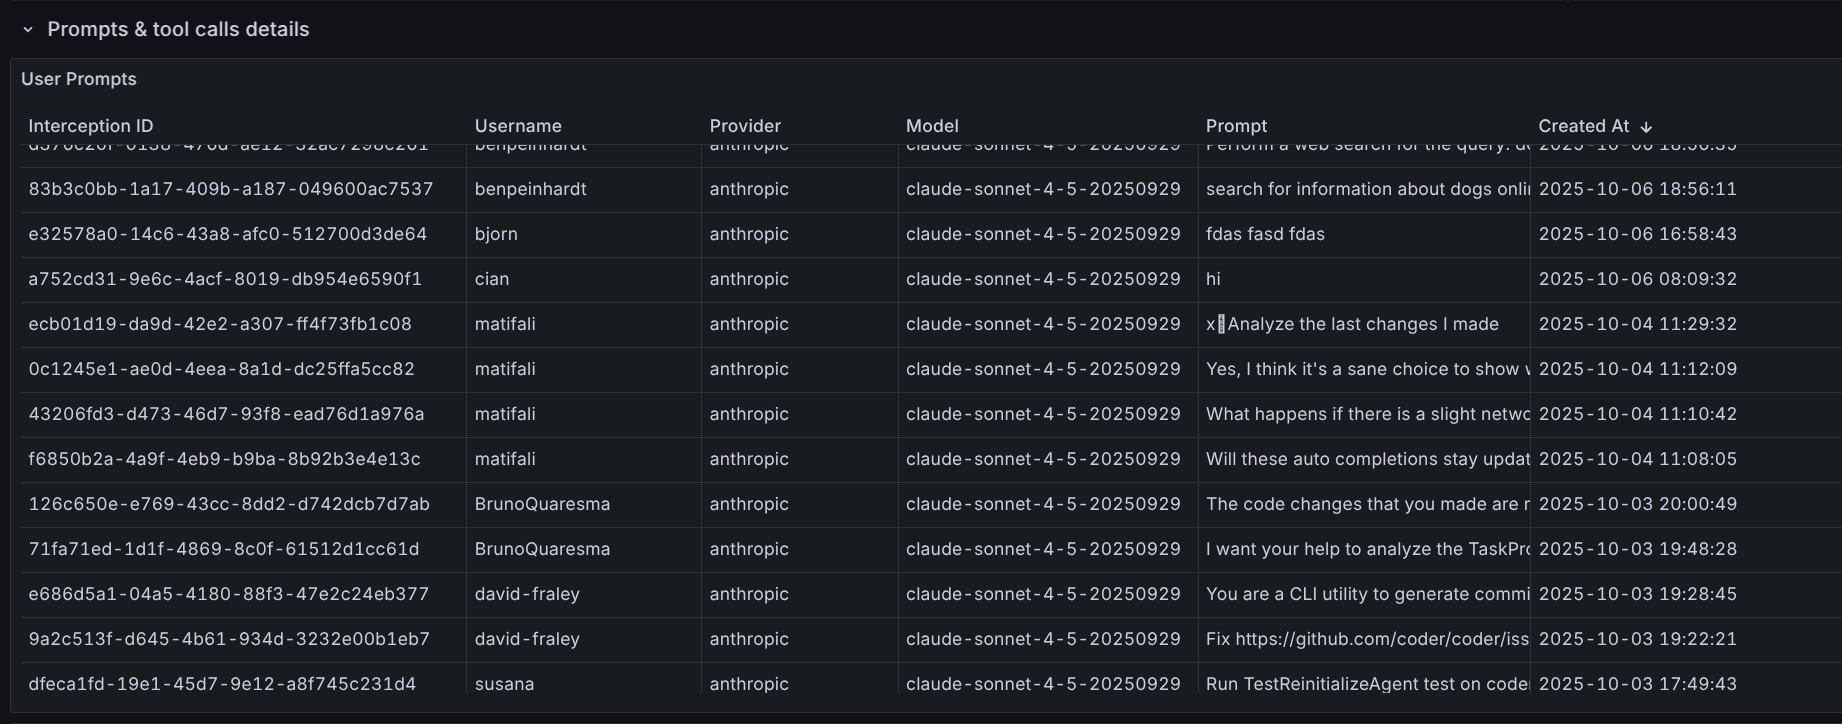
AI Gateway records the last user prompt, token usage, model reasoning, and every tool invocation for each intercepted request. Each capture is tied to a single "interception" that maps back to the authenticated Coder identity, making it easy to attribute spend and behaviour.
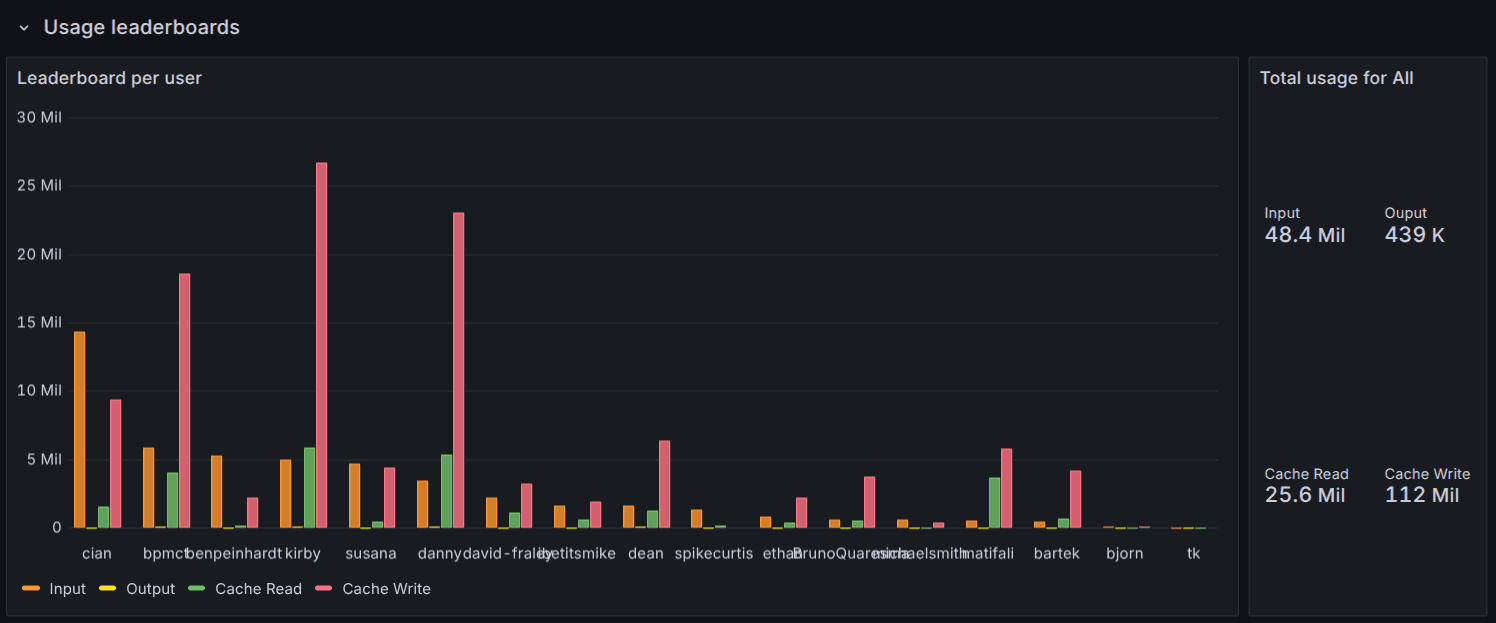
We provide an example Grafana dashboard that you can import as a starting point for your metrics. See the Grafana dashboard README.
These logs and metrics can be used to determine usage patterns, track costs, and evaluate tooling adoption.
Provider metrics
aibridged (the in-process daemon) and aibridgeproxyd (the external
proxy) each export Prometheus metrics describing the configured
provider pool and its reload loop. See
Provider Configuration for the lifecycle these
metrics describe.
Metric
Type
Labels
Purpose
coder_aibridged_provider_info
gauge
provider_name, provider_type, status
One series per configured provider. Value is always 1; the status label (enabled, disabled, error) carries the alertable signal.
Repeat the same query against coder_aibridgeproxyd_* if you run the
external proxy.
Structured Logging
AI Bridge can emit structured logs for every interception event to your
existing log pipeline. This is useful for exporting data to external SIEM or
observability platforms. See Structured Logging
in the setup guide for configuration and a full list of record types.
Exporting Data
AI Gateway interception data can be exported for external analysis, compliance reporting, or integration with log aggregation systems.
REST API
You can retrieve AI Gateway sessions via the Coder API, with filtering and pagination support.
curl -X GET "https://coder.example.com/api/v2/aibridge/sessions" \
  -H "Coder-Session-Token: $CODER_SESSION_TOKEN"
Available query filters:
client - Filter by client name.
Possible client values
[!NOTE]
Client classification is done on best effort basis using the User-Agent header;
not all clients send these headers in an easily-identifiable manner.
Claude Code
Codex
Zed
GitHub Copilot (VS Code)
GitHub Copilot (CLI)
Kilo Code
Coder Agents
Mux
Cursor
Unknown
initiator - Filter by user ID or username
provider - Filter by AI provider (e.g., openai, anthropic)
model - Filter by model name
started_after - Filter interceptions after a timestamp
started_before - Filter interceptions before a timestamp
See coder aibridge interceptions list --help for all options.
Data Retention
AI Gateway data is retained for 60 days by default. Configure the retention
period to balance storage costs with your organization's compliance and analysis
needs.
For configuration options and details, see Data Retention
in the AI Gateway setup guide.
Tracing
AI Gateway supports tracing via OpenTelemetry,
providing visibility into request processing, upstream API calls, and MCP server
interactions.
Enabling Tracing
AI Gateway tracing is enabled when tracing is enabled for the Coder server.
To enable tracing set CODER_TRACE_ENABLE environment variable or
--trace CLI flag:
export CODER_TRACE_ENABLE=true
coder server --trace
What is Traced
AI Gateway creates spans for the following operations:
Span Name
Description
CachedBridgePool.Acquire
Acquiring a request bridge instance from the pool
Intercept
Top-level span for processing an intercepted request
Intercept.CreateInterceptor
Creating the request interceptor
Intercept.ProcessRequest
Processing the request through the bridge
Intercept.ProcessRequest.Upstream
Forwarding the request to the upstream AI provider
Intercept.ProcessRequest.ToolCall
Executing a tool call requested by the AI model
Intercept.RecordInterception
Recording creating interception record
Intercept.RecordPromptUsage
Recording prompt/message data
Intercept.RecordTokenUsage
Recording token consumption
Intercept.RecordToolUsage
Recording tool/function calls
Intercept.RecordInterceptionEnded
Recording the interception as completed
ServerProxyManager.Init
Initializing MCP server proxy connections
StreamableHTTPServerProxy.Init
Setting up HTTP-based MCP server proxies
StreamableHTTPServerProxy.Init.fetchTools
Fetching available tools from MCP servers
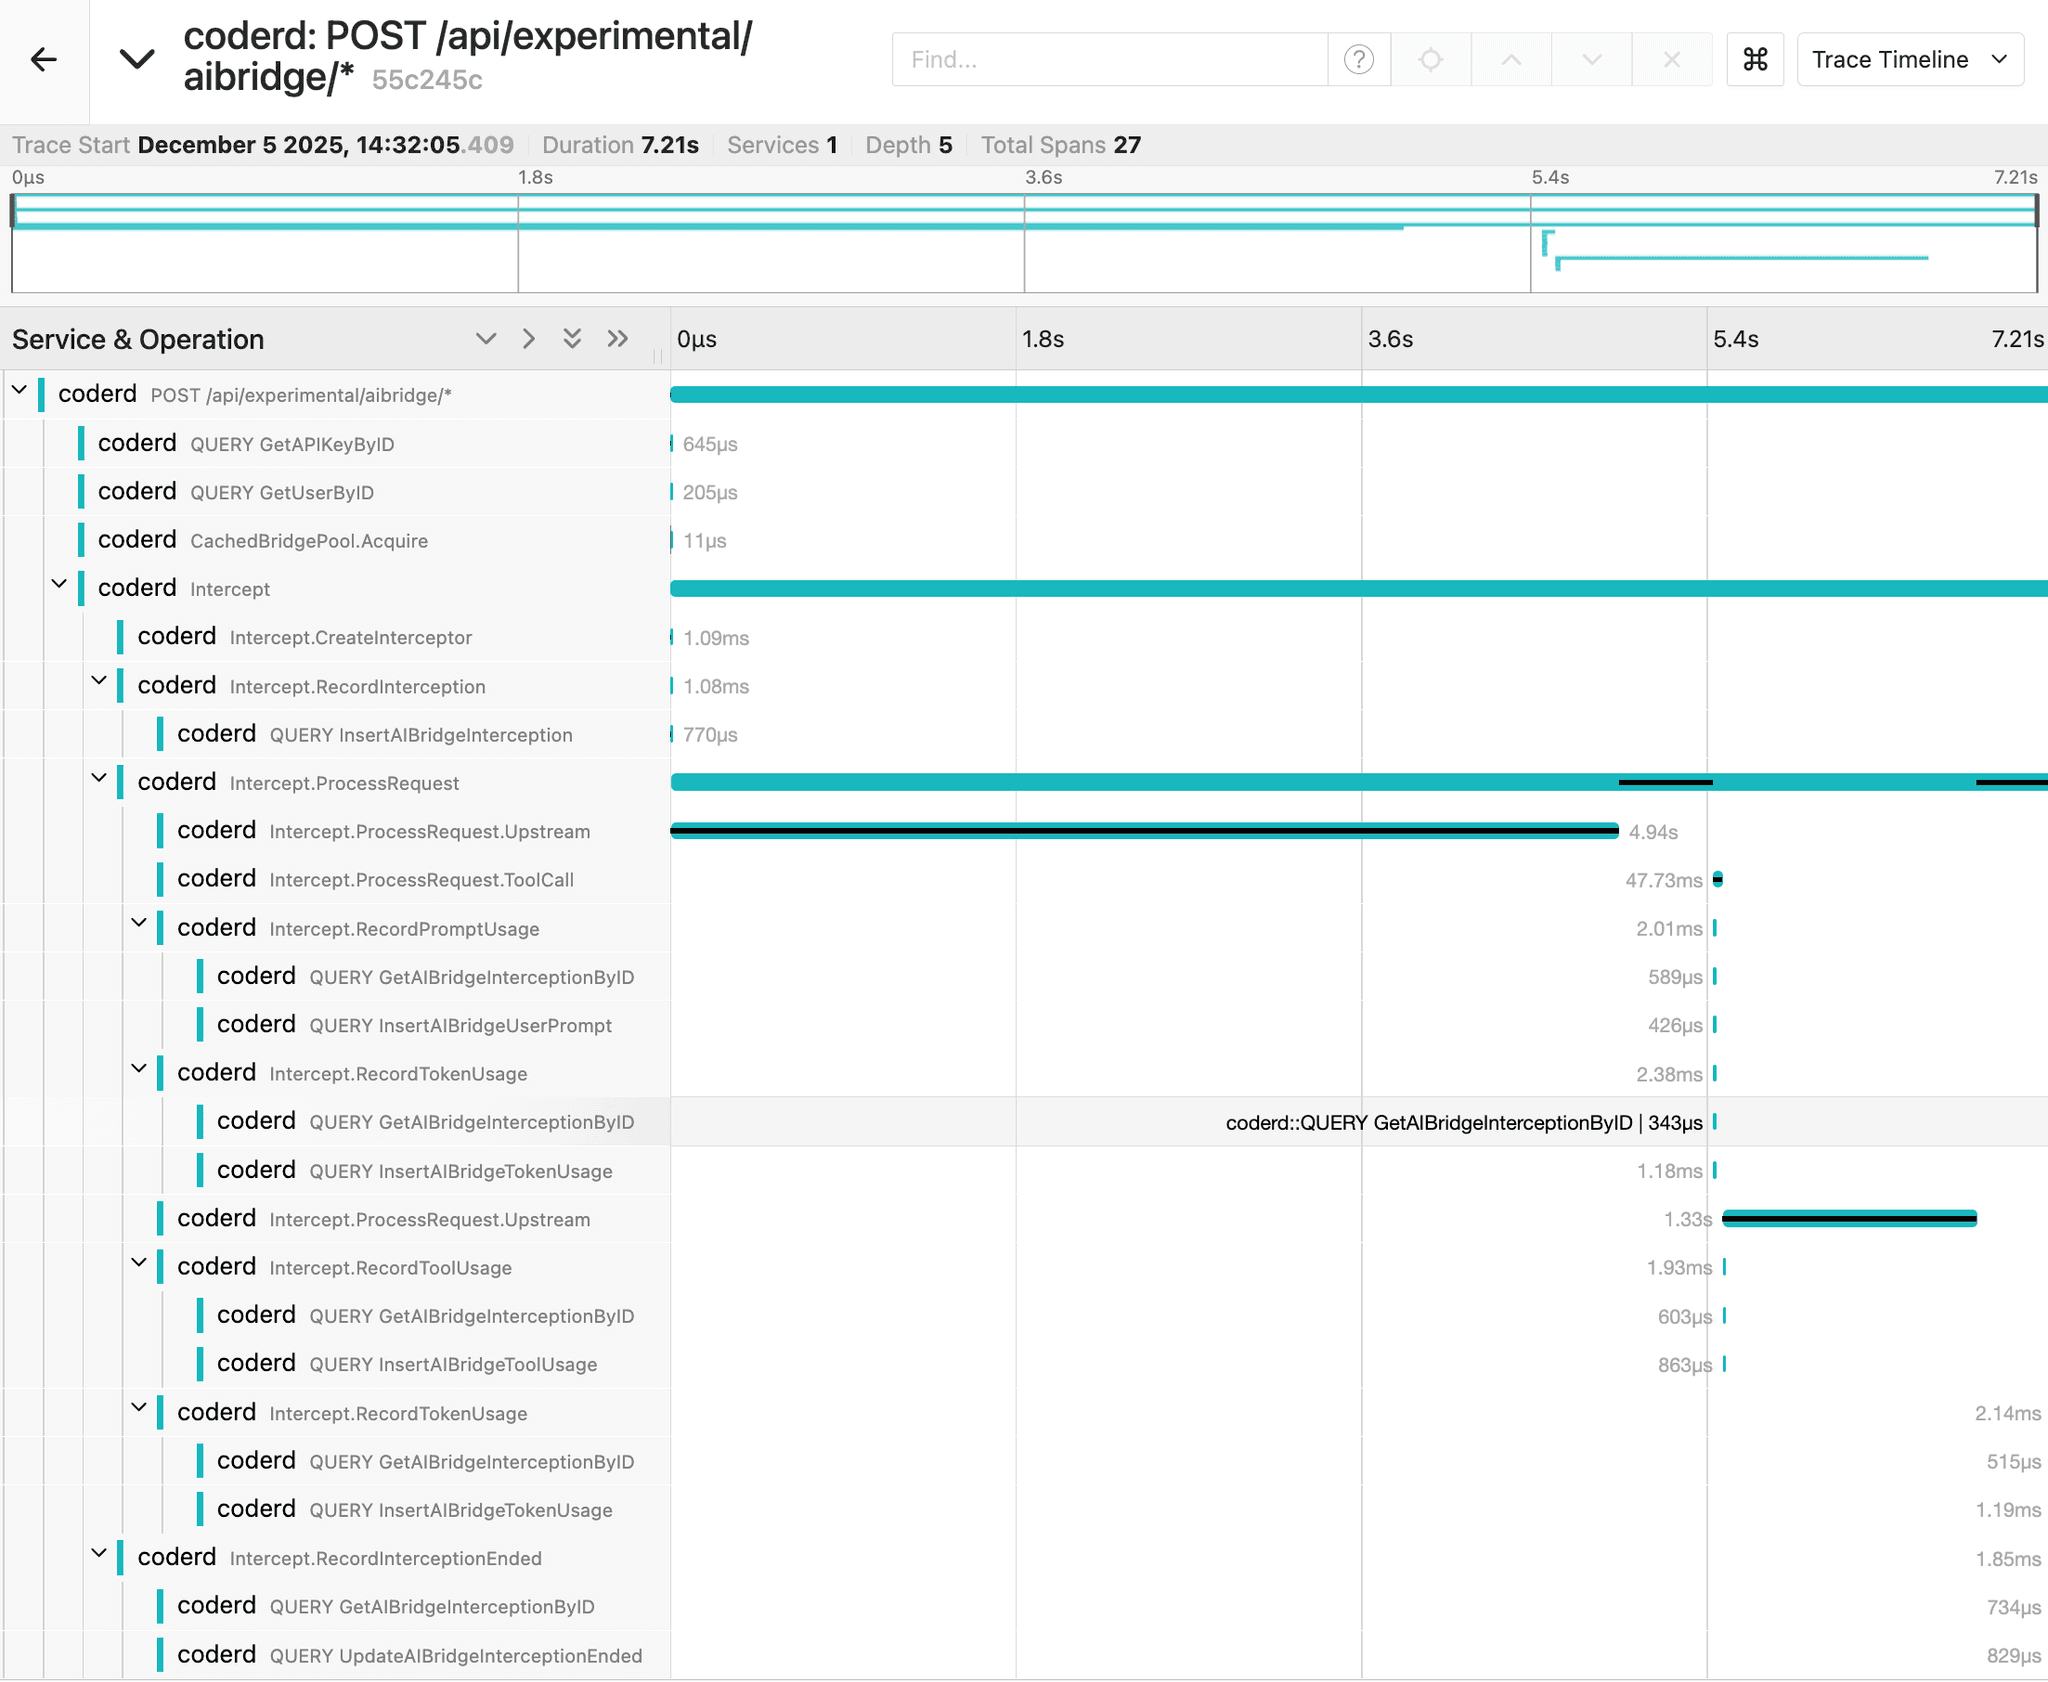
Example trace of an interception using Jaeger backend:
Capturing Logs in Traces
Note
Enabling log capture may generate a large volume of trace events.
To include log messages as trace events, enable trace log capture
by setting CODER_TRACE_LOGS environment variable or using
--trace-logs flag: