Coder powers secure, scalable development across key industries — automotive, finance, government, and technology — enabling faster builds, tighter compliance, and seamless AI adoption in enterprise-grade cloud environments.
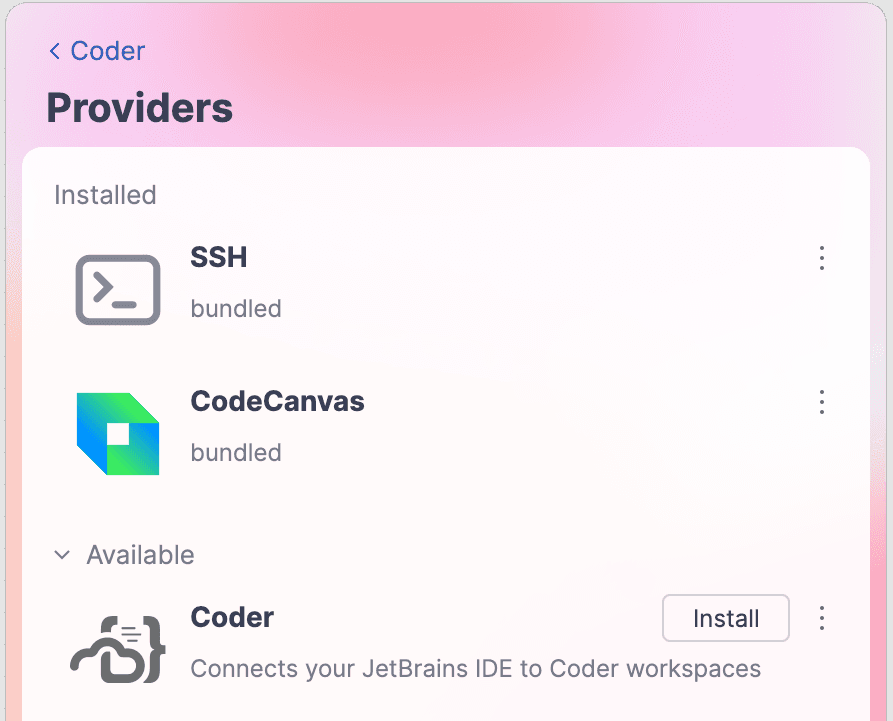
From the switcher drop-down, select Manage Providers.
In the Providers window, under the Available node, locate the Coder provider and click Install.
Connect
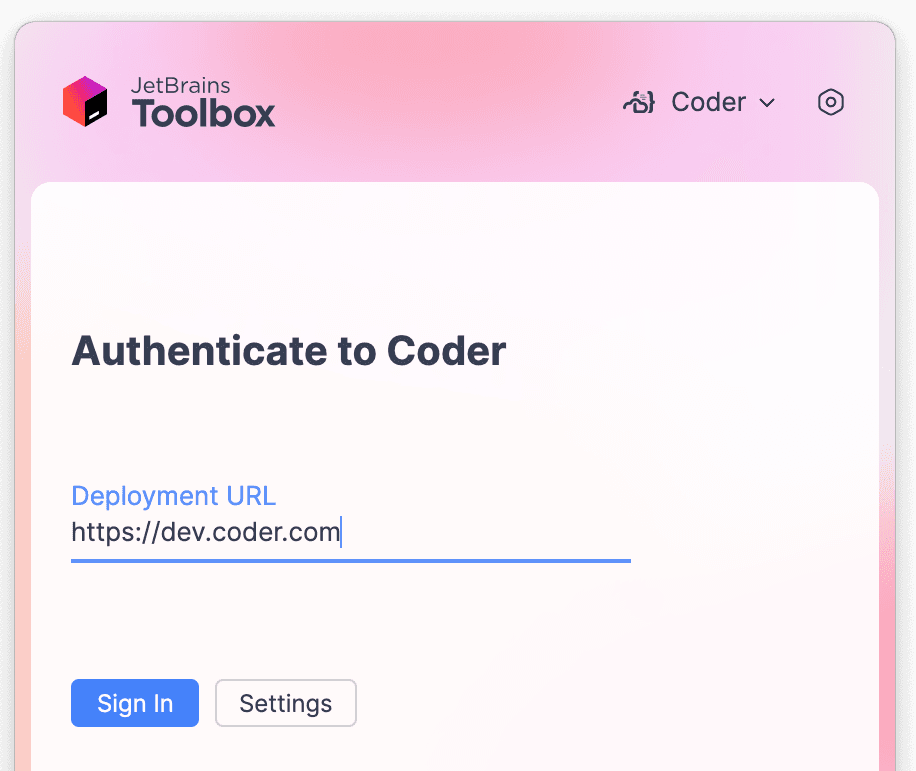
In the Toolbox App, click Coder.
Enter the URL address and click Sign In.
Authenticate to Coder adding a token for the session and click Connect.
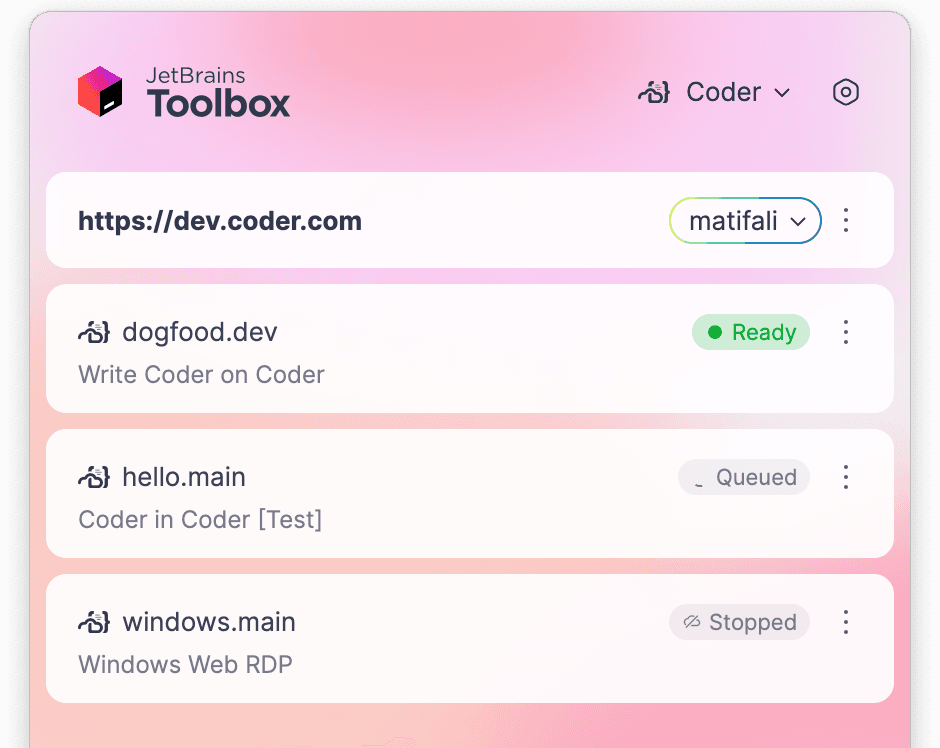
After the authentication is completed, you are connected to your development environment and can open and work on projects.
Use URI parameters
For direct connections or creating bookmarks, use custom URI links with parameters:
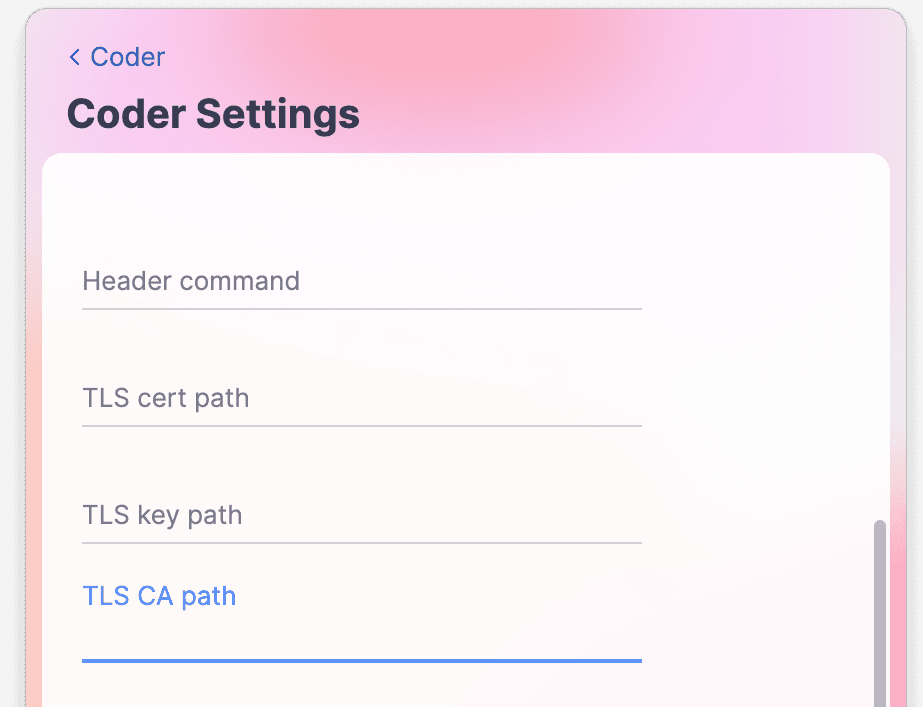
To connect to a Coder deployment that uses internal certificates, configure the certificates directly in the Coder plugin settings in JetBrains Toolbox:
In the Toolbox App, click Coder.
Click the (⋮) next to the username in top right corner.
Select Settings.
Add your certificate path in the CA Path field.
Troubleshooting
If you encounter issues connecting to your Coder workspace via JetBrains Toolbox, follow these steps to enable and capture debug logs:
Enable Debug Logging
Open Toolbox
Navigate to the Toolbox App Menu (hexagonal menu icon) > Settings > Advanced.
In the screen that appears, select DEBUG for the Log level: section.
Hit the back button at the top.
Retry the same operation
Capture Debug Logs
Access logs via Toolbox App Menu > About > Show log files.
Locate the log file named jetbrains-toolbox.log and attach it to your support ticket.
If you need to capture logs for a specific workspace, you can also generate a ZIP file using the Workspace action menu, available either on the main Workspaces page in Coder view or within the individual workspace view, under the option labeled Collect logs.